
Risk-off sentiment returned in today’s Asian session following a renewed spike in geopolitical risk premiums. This was driven by US President Trump’s reversal over the weekend, abandoning his earlier “two-week grace period” and authorizing airstrikes on three Iranian nuclear enrichment facilities.
/*
Requesting advertisement by calling an endpoint assures that
the advertisement is never cached together with the page.
aHpsG – is a forced measure to prevent JS function from
being overwritten.
*/
function load_advertisement_aHpsG(){
let adSlot = document.getElementById(‘ad-slot-container-aHpsG’);
fetch(‘/load-advertisement/26/?is_sidebar=False’)
.then(response => response.text())
.then(html => {
adSlot.outerHTML = html;
})
.catch(error => {
console.error(‘Error fetching the template:’, error);
});
}
load_advertisement_aHpsG();
US futures extended losses, with Asian equities, except for the Hang Seng Index
US stock index futures extended their post “Triple Witching” losses, with S&P 500 and Nasdaq 100 E-mini futures down -0.3% and -0.4%, respectively, in mid-session trading.
Most Asian equity benchmarks also traded lower: Japan’s Nikkei 225 slipped -0.2%, and Singapore’s Straits Times Index declined -0.4%. Bucking the trend, Hong Kong’s Hang Seng Index rose 0.2%, likely supported by expectations of further stimulus announcements at China’s four-day National People’s Congress Standing Committee meeting, which begins Tuesday, 24 June.
Aussie, Kiwi, and Japanese yen are the worst performers against the US dollar
The US dollar strengthened modestly in response to the airstrikes, with the US Dollar Index up 0.3% intraday. High-beta currencies such as the Australian and New Zealand dollars, which typically weaken during equity market sell-offs, underperformed. The USD/JPY climbed 0.7%, while AUD/USD and NZD/USD fell by 0.7%.
WTI trimmed its early intraday gain of 4.1% but is still holding above key support
WTI crude oil pared back an early 4.1% gap-up rally to trade up 0.7% at US$75.86/barrel, holding above gap support at US$75.40. Gold (XAU/USD), after an early gain of 0.6%, reversed to a -0.6% intraday loss, once again testing its 20-day moving average support at US$3,350, a key technical level since 21 May.
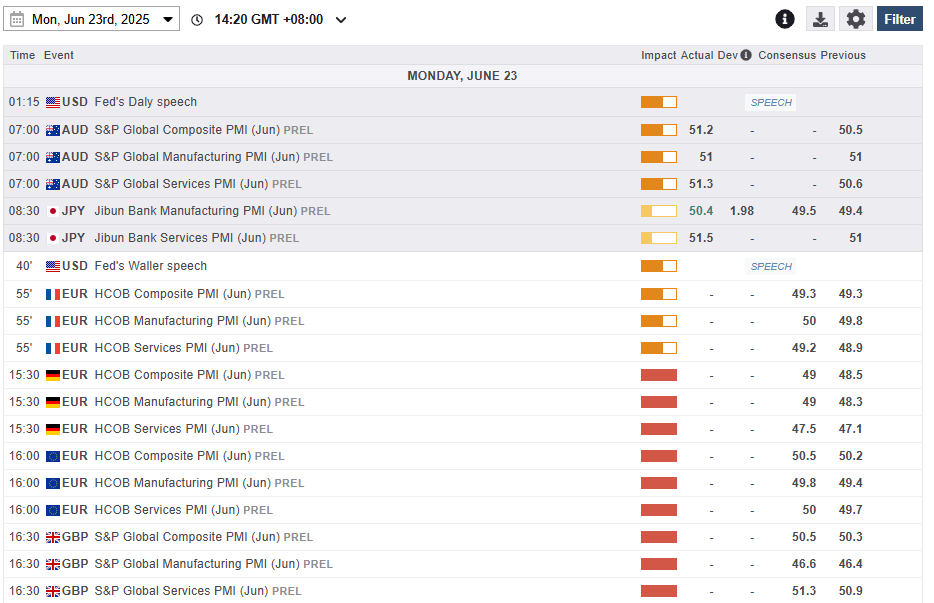
Economic data releases
const imageElement = document.getElementById(‘pinch-to-zoom-img-3983’);
if (imageElement) {
panzoom(imageElement, {
maxZoom: 4.0,
minZoom: 0.5,
contain: ‘outside’,
});
}
}, 100);
}
}
}”
x-init=”$watch(‘imgModal’, value => initPanzoom())”
class=”flex “>
Fig 1: Key data for today’s Asia mid-session (Source: MarketPulse)
/*
Requesting advertisement by calling an endpoint assures that
the advertisement is never cached together with the page.
oreKB – is a forced measure to prevent JS function from
being overwritten.
*/
function load_advertisement_oreKB(){
let adSlot = document.getElementById(‘ad-slot-container-oreKB’);
fetch(‘/load-advertisement/30/?is_sidebar=False’)
.then(response => response.text())
.then(html => {
adSlot.outerHTML = html;
})
.catch(error => {
console.error(‘Error fetching the template:’, error);
});
}
load_advertisement_oreKB();
Chart of the day – Nasdaq 100 continues to probe the 21,500 downside trigger
const imageElement = document.getElementById(‘pinch-to-zoom-img-4458’);
if (imageElement) {
panzoom(imageElement, {
maxZoom: 4.0,
minZoom: 0.5,
contain: ‘outside’,
});
}
}, 100);
}
}
}”
x-init=”$watch(‘imgModal’, value => initPanzoom())”
class=”flex “>
Fig 2: US Nasdaq 100 CFD Index minor trend as of 23 June 2025 (Source: TradingView)

The US Nasdaq 100 CFD Index (a proxy of the Nasdaq 100 E-mini futures) has staged a gap-down decline of -1% in today’s Asian opening session before it pared back its intraday losses to -0.3% at this time of writing.
The current intraday rebound on the US Nasdaq 100 has occurred for the third time right at the 21,500 key near-term support, now a likely downside trigger level for the bears.
Overall, the short-term technical structure is skewing towards a bearish bias as price actions of the US Nasdaq 100 CFD Index have traded below its 20-day moving average, and the hourly RSI momentum indicator remains below a parallel descending resistance at around the 62 level.
Watch the 22,050 key pivotal resistance, and a break below 21,500 may kickstart of minor downtrend phase in the first step, exposing the next intermediate support zone at 21,180/21,030 (see Fig 2).
On the flip side, a clearance above 22,050 invalidates the bearish scenario for a retest on its current all-time area of 22,200/22,250.
Opinions are the authors’; not necessarily that of OANDA Business Information & Services, Inc. or any of its affiliates, subsidiaries, officers or directors. The provided publication is for informational and educational purposes only.
If you would like to reproduce or redistribute any of the content found on MarketPulse, an award winning forex, commodities and global indices analysis and news site service produced by OANDA Business Information & Services, Inc., please refer to the MarketPulse Terms of Use.
Visit https://www.marketpulse.com/ to find out more about the beat of the global markets.
© {CURRENT_YEAR} OANDA Business Information & Services Inc.
