

More than half a billion in long positions were liquidated across the crypto market on Monday as the price of Bitcoin dropped to $112,000 amid a broader market tumble.

Around 405,300 traders have been liquidated to the tune of more than $1.7 billion over the past two hours as Bitcoin (BTC) fell to a two-week low, slashing its gains after the US Federal Reserve cut lending interest rates by 25 bps last week.
The majority of liquidations were long positions, according to CoinGlass, which came as Bitcoin dropped to $112,000 on Bitstamp, its lowest price since September 10.
Over $1.6 billion in long positions were liquidated, with Ethereum (ETH) accounting for $300 million of that total as it dropped 10% to $4,000, followed by Bitcoin with $210 million in long liquidations.

Dogecoin (DOGE) led the losses among the top 10 cryptocurrencies by market capitalization, dropping 10% over the past 24 hours to $0.24 and wiping out $33 million in long positions.
“Dips are important for establishing support levels, which are like the foundation of a house,” said Binance founder and former CEO, Changpeng Zhao, in an X post on Monday.
The Bitcoin liquidation heatmap showed the price eating away liquidity below $112,000, with more than $400 million bid orders sitting between $112,000 and $110,000.
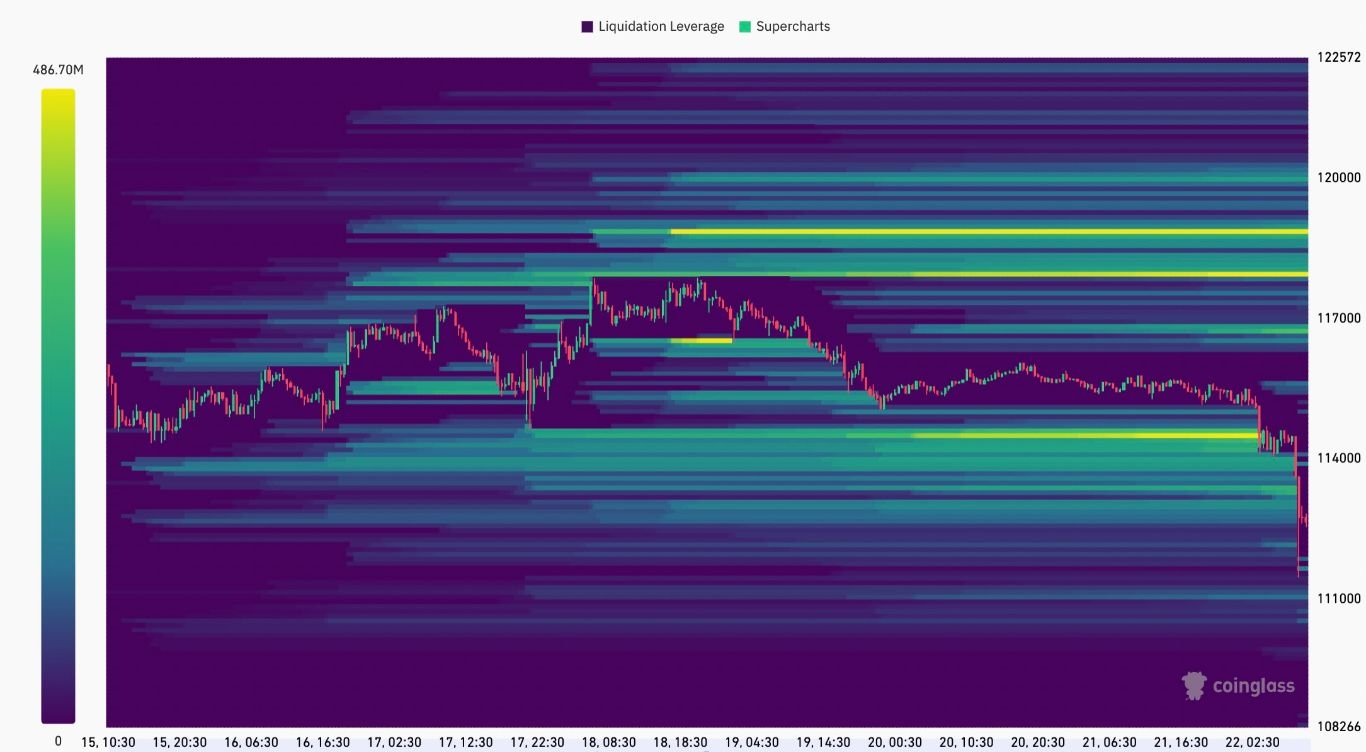
A break below $112,000 could see the price rise to grab liquidity, sitting down to the $110,000 level.
Bitcoin Must Hold $112,000 to Avoid Deeper Correction
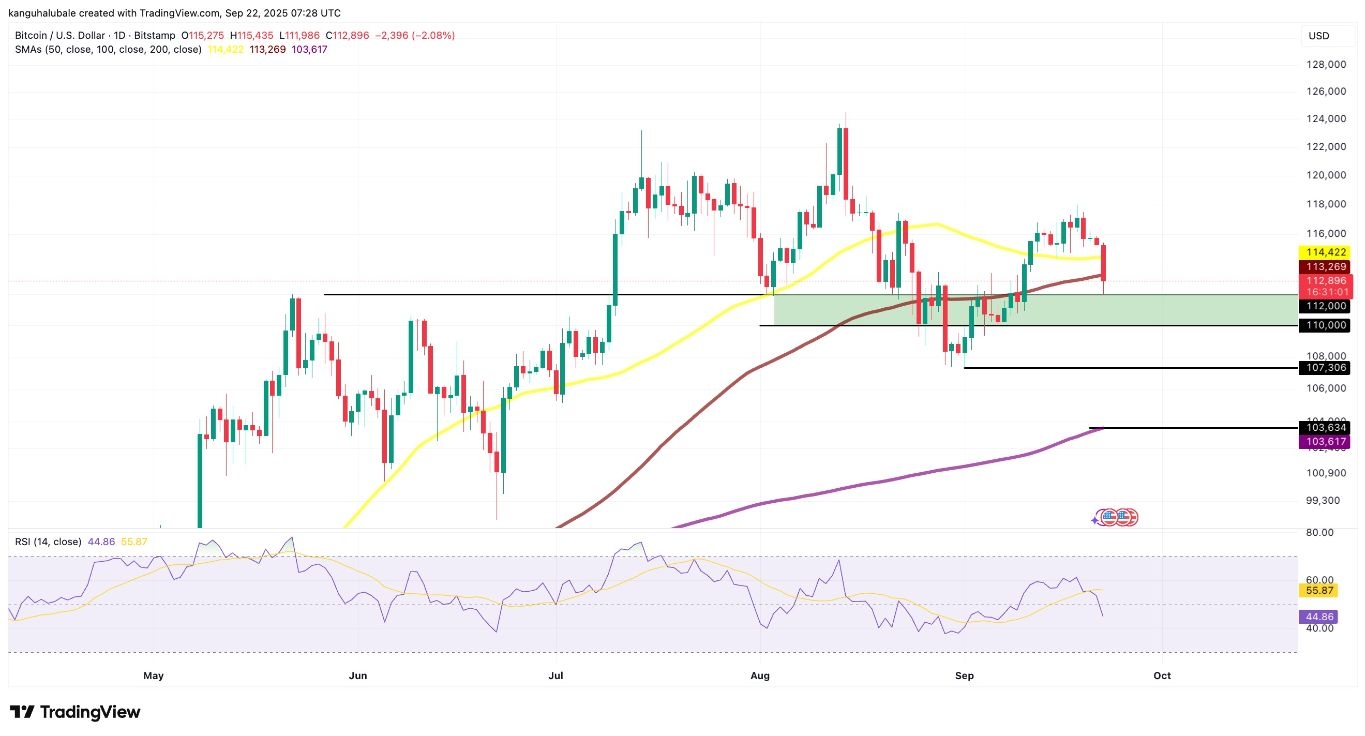
Bitcoin is down more than 4% from Sunday’s high of $115,900 to today’s intraday low of $112,000.
This drop saw the Bitcoin price lose the levels: the 50-day simple moving average (SMA) at $114,400 and the 100-day SMA at $113,270. This reinforces the intensity of the sell-side pressure as traders turned bearish.
“$BTC has lost the up channel and now swept last week’s low,” said popular analyst AlphaBTC in an X post analysis, adding:
“It MUST hold here or I fear a deeper correction into the end of the month and even into October.”
He was referring to the zone between $112,000 and $110,000, which, if lost, would trigger another cascade of long liquidations, with local lows at $107,000 being the next area of interest.
Below that, the 200-day SMA $103,600 could be a safe haven for the bulls, where they could take a breather and regroup before making another attempt at recovery.
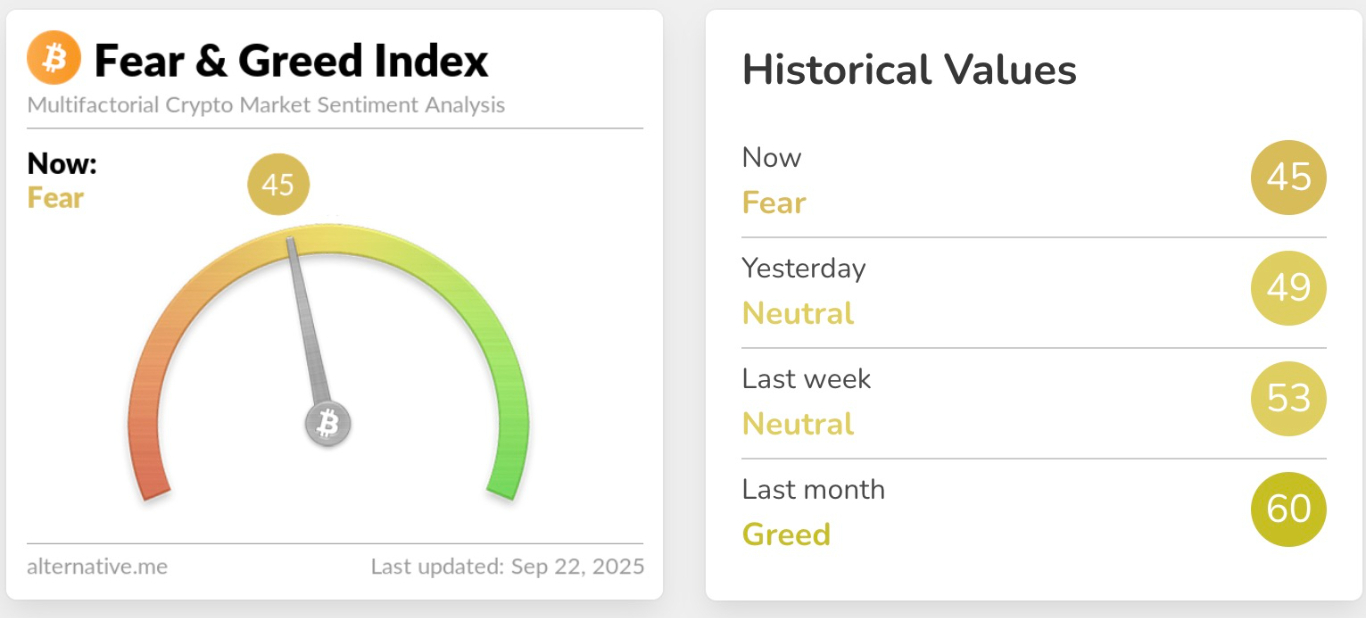
 Meanwhile, the Crypto Fear and Greed index has now slipped into the fear zone, for the first time since August 31, suggesting that market investors are now flipping bearish.
October is usually a bullish month during crypto bull market years, and with the current drawdown in the market, there are fears that what has always been known as an ‘Uptober’ could bring losses for crypto investors.
Ready to trade our technical analysis of Bitcoin? Here’s our list of the best MT4 crypto brokers worth checking out.
