

- The Dow Jones eased further below 45,000 to start the new week.
- Equities are taking a breather after last week’s bullish showing.
- A quiet start to the week gives way to this year’s Jackson Hole symposium.
The Dow Jones Industrial Average (DJIA) eased slightly on Monday, paring last week’s gains. A quiet start to the week is giving investors some room to breathe before the next round of key economic data, as well as the start of this year’s economic symposium at Jackson Hole.
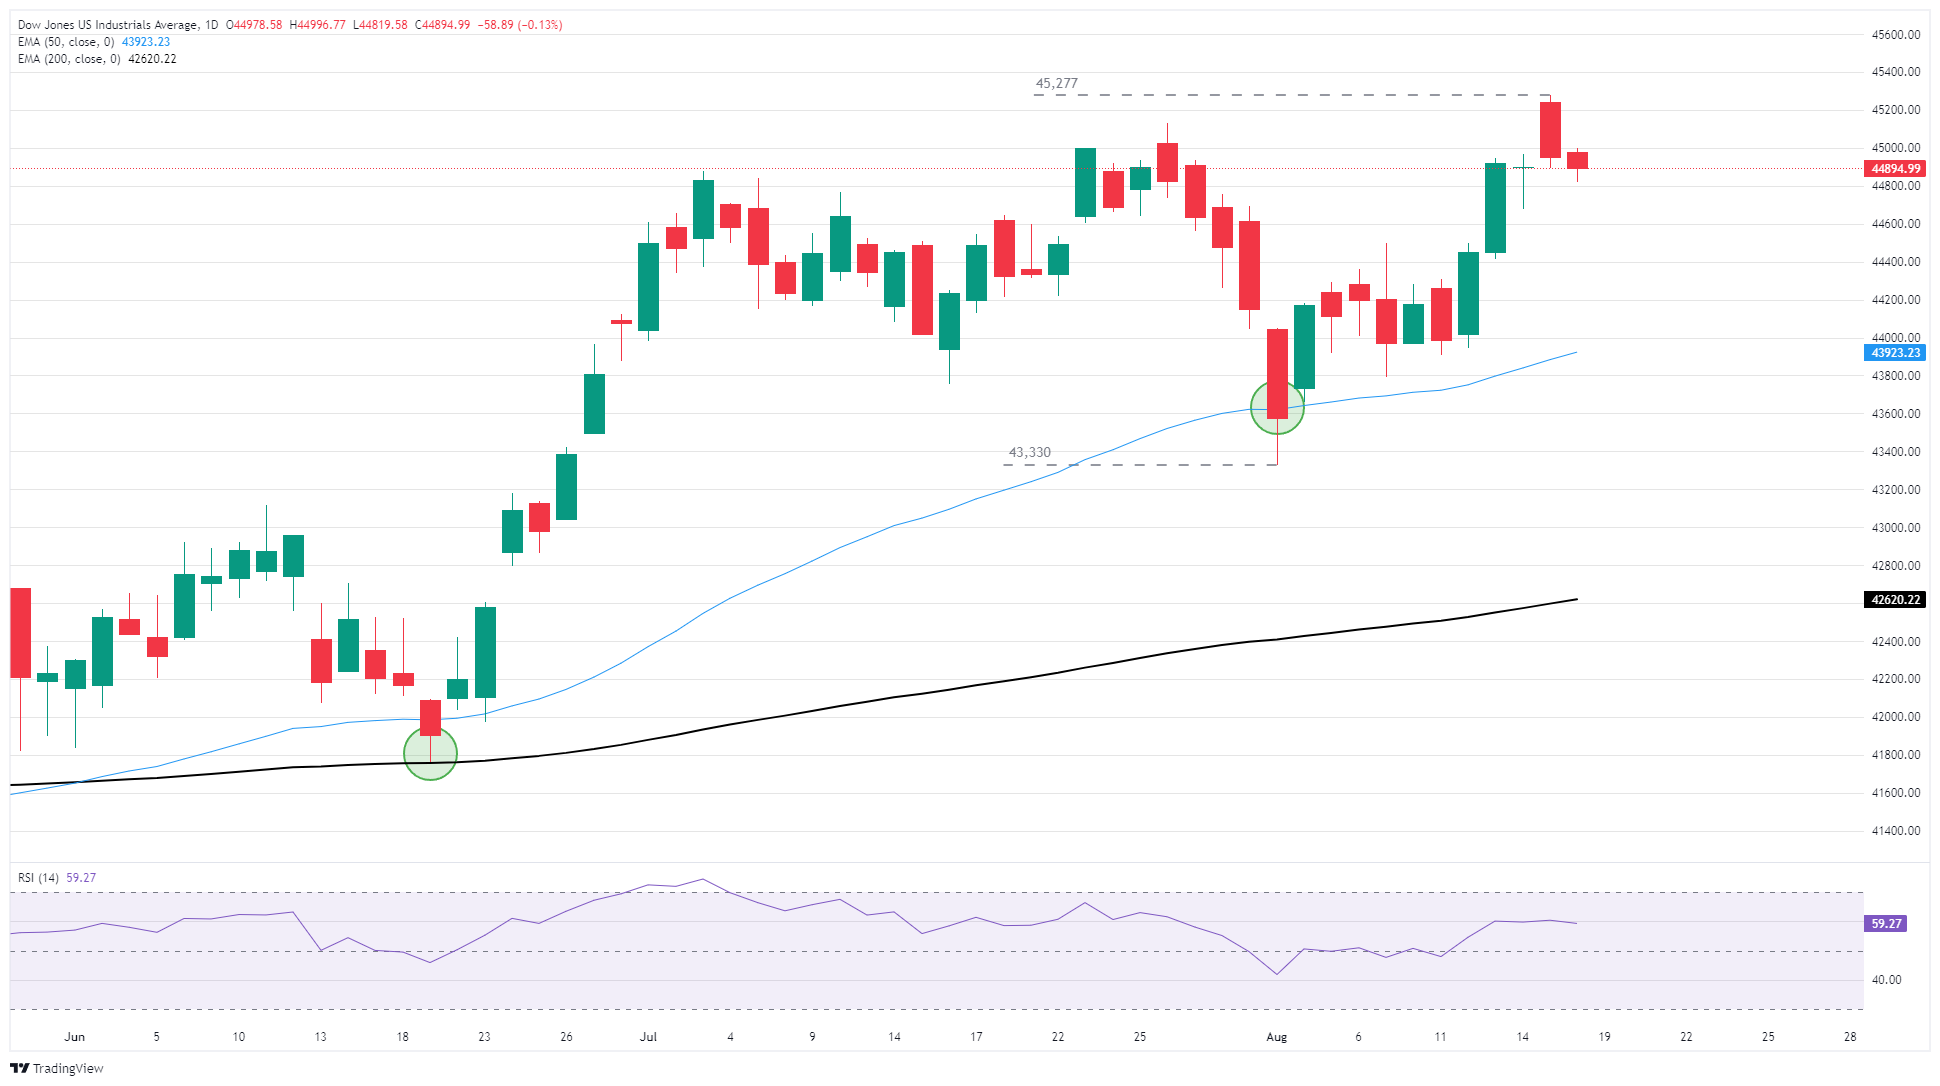
The Dow Jones clipped into fresh all-time highs last week, reaching a record peak of 45,277 before easing back below 45,000. Despite cooling bullish pressure, the Dow is still holding steady on the high end, trading well above the 50-day Exponential Moving Average (EMA) near 43,920.
Central bank policy to get a front seat this week
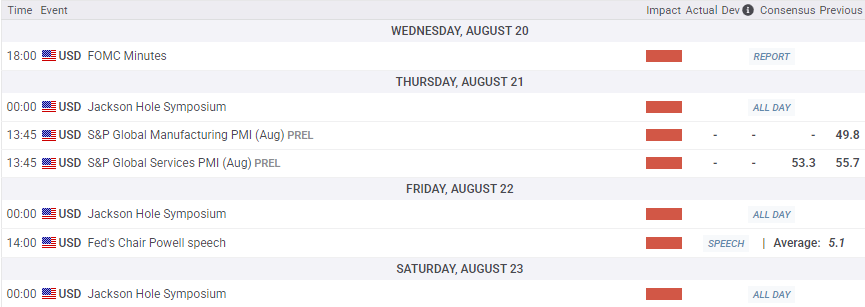
Investors are getting an easy start, with little of note on the data docket through the front half of the trading week. Meeting Minutes from the Federal Reserve’s (Fed) latest interest rate decision will be released on Wednesday, but the key events this week will be S&P Global Purchasing Managers Index (PMI) survey results for August, slated for Thursday. The annual Jackson Hole Economic Policy Symposium hosted by the Fed Bank of Kansas City also kicks off this Thursday, and traders should expect soundbites and headlines to leak out of the policy shindig through the bottom half of the trading week. Fed Chair Jerome Powell will speak at Jackson Hole on Friday.
US inflation data sparked some fresh concerns among global markets last week, however, overall investor sentiment is still pricing in a Fed rate cut on September 17. According to the CME’s FedWatch Tool, rate traders are pricing in over 80% odds of at least a quarter-point rate cut next month, with nearly 90% odds of a follow-up cut in December.
Read more stock news: Retail earnings set to steer S&P 500: WMT, HD, LOW and TGT
Dow Jones daily chart
Economic Indicator
S&P Global Composite PMI
The S&P Global Composite Purchasing Managers Index (PMI), released on a monthly basis, is a leading indicator gauging US private-business activity in the manufacturing and services sector. The data is derived from surveys to senior executives. Each response is weighted according to the size of the company and its contribution to total manufacturing or services output accounted for by the sub-sector to which that company belongs. Survey responses reflect the change, if any, in the current month compared to the previous month and can anticipate changing trends in official data series such as Gross Domestic Product (GDP), industrial production, employment and inflation. The index varies between 0 and 100, with levels of 50.0 signaling no change over the previous month. A reading above 50 indicates that the private economy is generally expanding, a bullish sign for the US Dollar (USD). Meanwhile, a reading below 50 signals that activity is generally declining, which is seen as bearish for USD.
Read more.
Next release:
Thu Aug 21, 2025 13:45 (Prel)
Frequency:
Monthly
Consensus:
–
Previous:
55.1
Source:
S&P Global
