
The Sunday Market Open got filled with gaps and while most of them have been tested by retracting prices, all markets are still trading at different levels compared to the Friday close. EUR/USD wasn’t left out.
There has been a theme of covering selling positions against the US Dollar and this surely started to take place through last week as the Dollar Index hit a 97.69 low.
We have witnessed some swift changes to Mid-May and beginning-June Forex flows as Dollar selling resumed and EUR/USD went to 1.1140 to highs of 1.1610 in the same period.
The US entered the Israel-Iran Conflict, and a press release from the Kremlin Spokesman came this morning saying that Saturday’s attack from the US “had increased the number of participants in the conflict and ushered in a new spiral of escalation” – More developments on this as markets see more headlines.
War market flows have officially put the USD back in the conversation, therefore an analysis to spot levels of interest in the most traded forex pair amid this newfound volatility is now-due.
Read More: Trading Wheat in increased volatility – Expanding trading horizons
/*
Requesting advertisement by calling an endpoint assures that
the advertisement is never cached together with the page.
HDEnT – is a forced measure to prevent JS function from
being overwritten.
*/
function load_advertisement_HDEnT(){
let adSlot = document.getElementById(‘ad-slot-container-HDEnT’);
fetch(‘/load-advertisement/26/?is_sidebar=False’)
.then(response => response.text())
.then(html => {
adSlot.outerHTML = html;
})
.catch(error => {
console.error(‘Error fetching the template:’, error);
});
}
load_advertisement_HDEnT();
EUR/USD Multi-Timeframe analysis from Daily to Intra-day Charts
EUR/USD Daily Chart
const imageElement = document.getElementById(‘pinch-to-zoom-img-8171’);
if (imageElement) {
panzoom(imageElement, {
maxZoom: 4.0,
minZoom: 0.5,
contain: ‘outside’,
});
}
}, 100);
}
}
}”
x-init=”$watch(‘imgModal’, value => initPanzoom())”
class=”flex “>
EUR/USD Daily Chart, June 23, 2025 – Source: TradingView

EUR/USD rejected the 1.1630 highs after consolidating throughout the past weeks around this key level.
The formation of a divergence on the Daily RSI has provided some underlying weakness in the previous upmove which led to some correction, particularly after last week’s FED Meeting.
Buyers had used the 20-Day Moving Average to bring the pair back into the 1.1520 to 1.1573 Main Resistance Zone.
The Daily 50 (1.1350) and 200 (1.0850) MAs are still a few handles below, leaving some space for correction in a strong selling scenario for the pair – The scenario is however still out of the current picture.
EUR/USD 4H Chart
const imageElement = document.getElementById(‘pinch-to-zoom-img-9733’);
if (imageElement) {
panzoom(imageElement, {
maxZoom: 4.0,
minZoom: 0.5,
contain: ‘outside’,
});
}
}, 100);
}
}
}”
x-init=”$watch(‘imgModal’, value => initPanzoom())”
class=”flex “>
EUR/USD 4H Chart, June 23, 2025 – Source: TradingView

Mean-reversion buying as created a strong bullish 4H candle pointing towards a test of the Main Resistance.
Sellers had failed to hold below the 1.1450 overnight gap support lows which led to a decent rally post-consolidation, currently heading to levels above the overnight gap-fill.
Momentum is strong with the RSI going back above the neutral zone and immediately breaking above the 4H MA 50. A push back below the key moving average would give back the hand to sellers.
EUR/USD 1H Chart
const imageElement = document.getElementById(‘pinch-to-zoom-img-3231’);
if (imageElement) {
panzoom(imageElement, {
maxZoom: 4.0,
minZoom: 0.5,
contain: ‘outside’,
});
}
}, 100);
}
}
}”
x-init=”$watch(‘imgModal’, value => initPanzoom())”
class=”flex “>
EUR/USD 1H Chart, June 23, 2025 – Source: TradingView
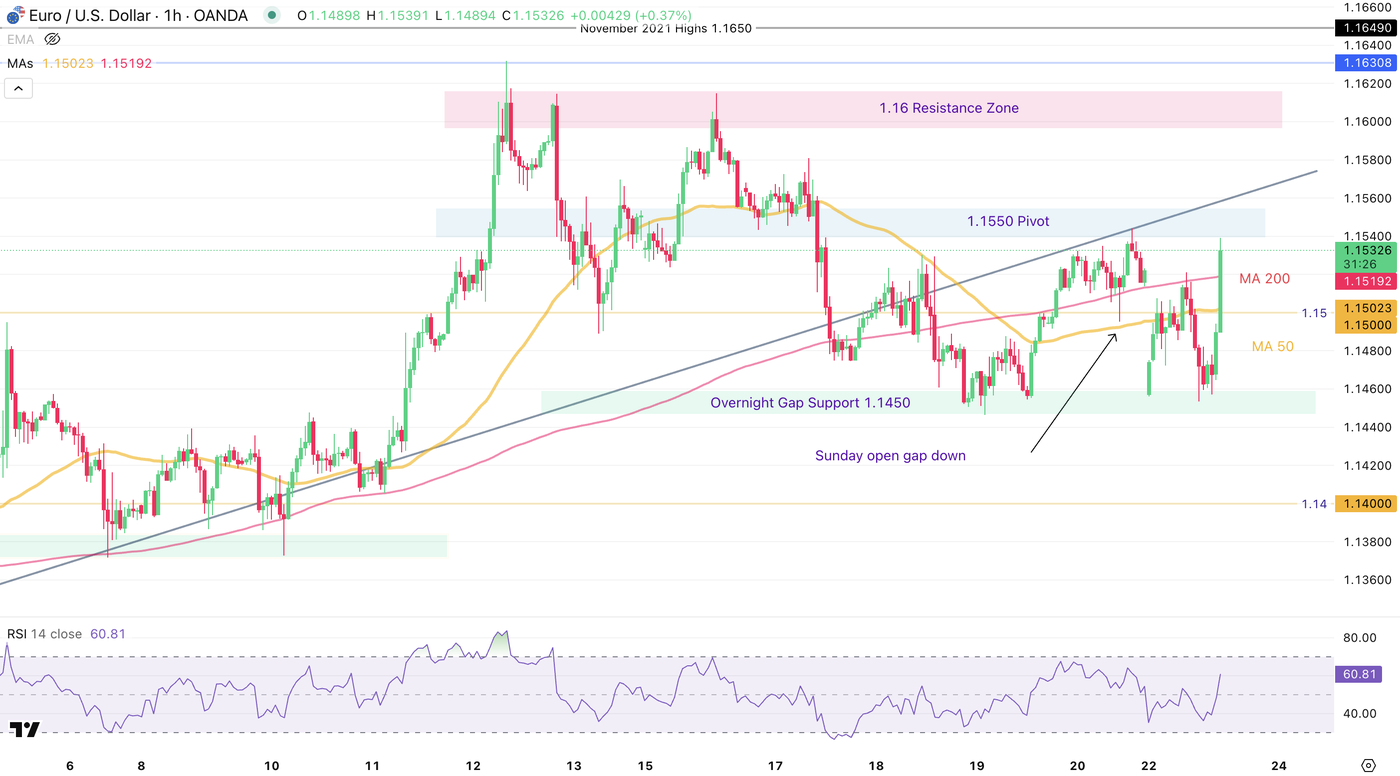
The Hourly candle is closing just off its highs as prices are now entering the 1.1550 Pivot Zone (+/- 100 pip) in confluence with a test of the Mid-May upwards trendline.
Buyers would need to keep pushing above the trendline to test the 1.16 psychological resistance.
A failure to do so would attract sellers towards a retest of the overnight lows, and a further break points towards the 1.14 Psychological level.
Safe Trades!
/*
Requesting advertisement by calling an endpoint assures that
the advertisement is never cached together with the page.
cbUav – is a forced measure to prevent JS function from
being overwritten.
*/
function load_advertisement_cbUav(){
let adSlot = document.getElementById(‘ad-slot-container-cbUav’);
fetch(‘/load-advertisement/30/?is_sidebar=False’)
.then(response => response.text())
.then(html => {
adSlot.outerHTML = html;
})
.catch(error => {
console.error(‘Error fetching the template:’, error);
});
}
load_advertisement_cbUav();
Opinions are the authors’; not necessarily that of OANDA Business Information & Services, Inc. or any of its affiliates, subsidiaries, officers or directors. The provided publication is for informational and educational purposes only.
If you would like to reproduce or redistribute any of the content found on MarketPulse, an award winning forex, commodities and global indices analysis and news site service produced by OANDA Business Information & Services, Inc., please refer to the MarketPulse Terms of Use.
Visit https://www.marketpulse.com/ to find out more about the beat of the global markets.
© {CURRENT_YEAR} OANDA Business Information & Services Inc.