
The Ichimoku Cloud is a technical analysis tool designed to provide traders with a rapid, comprehensive view of market trends, momentum, and future support and resistance levels. Developed in Japan in the 1930s, the indicator provides a structured framework that helps traders determine whether markets are trending, ranging, overextended, or trading at fair value — all from a single chart.
The origins and purpose of the Ichimoku Cloud
Ichimoku was developed by Goichi Hosoda in Japan during the 1930s. The term “Ichimoku” translates roughly to “one-look equilibrium chart,” reflecting the indicator’s goal of summarizing market conditions instantly.
At first glance, the Ichimoku Cloud can appear complex, especially when viewed alongside additional tools such as trend lines or Fibonacci retracements. This visual density often leads traders to dismiss it as overly complicated. However, this complexity becomes manageable once the purpose of each component is clearly understood.
The Ichimoku Cloud was designed to function as a complete analytical system rather than a single signal-based indicator.
What the Ichimoku Cloud is – and what it is not
The Ichimoku Cloud is a trend-following system, a market structure framework, a probability filter, and a trade management tool. A unique feature of the indicator is its ability to project future support and resistance levels.
However, the Ichimoku Cloud is not designed to identify market reversals, nor is it intended for short-term scalping strategies. Traders who struggle with Ichimoku often attempt to force it to perform tasks it was never designed to do.
The system was built to analyze medium-term market movements. The 26-period setting reflects the average number of working days in a Japanese trading month at the time of its creation. While the indicator can be adapted down to the four-hour timeframe, using it on lower timeframes significantly reduces the effectiveness of the cloud’s structure.
Setting up the Ichimoku Cloud on a chart
The Ichimoku Cloud is available on most major charting platforms. On TradingView, it can be accessed directly through the indicators menu by searching for “Ichimoku.”
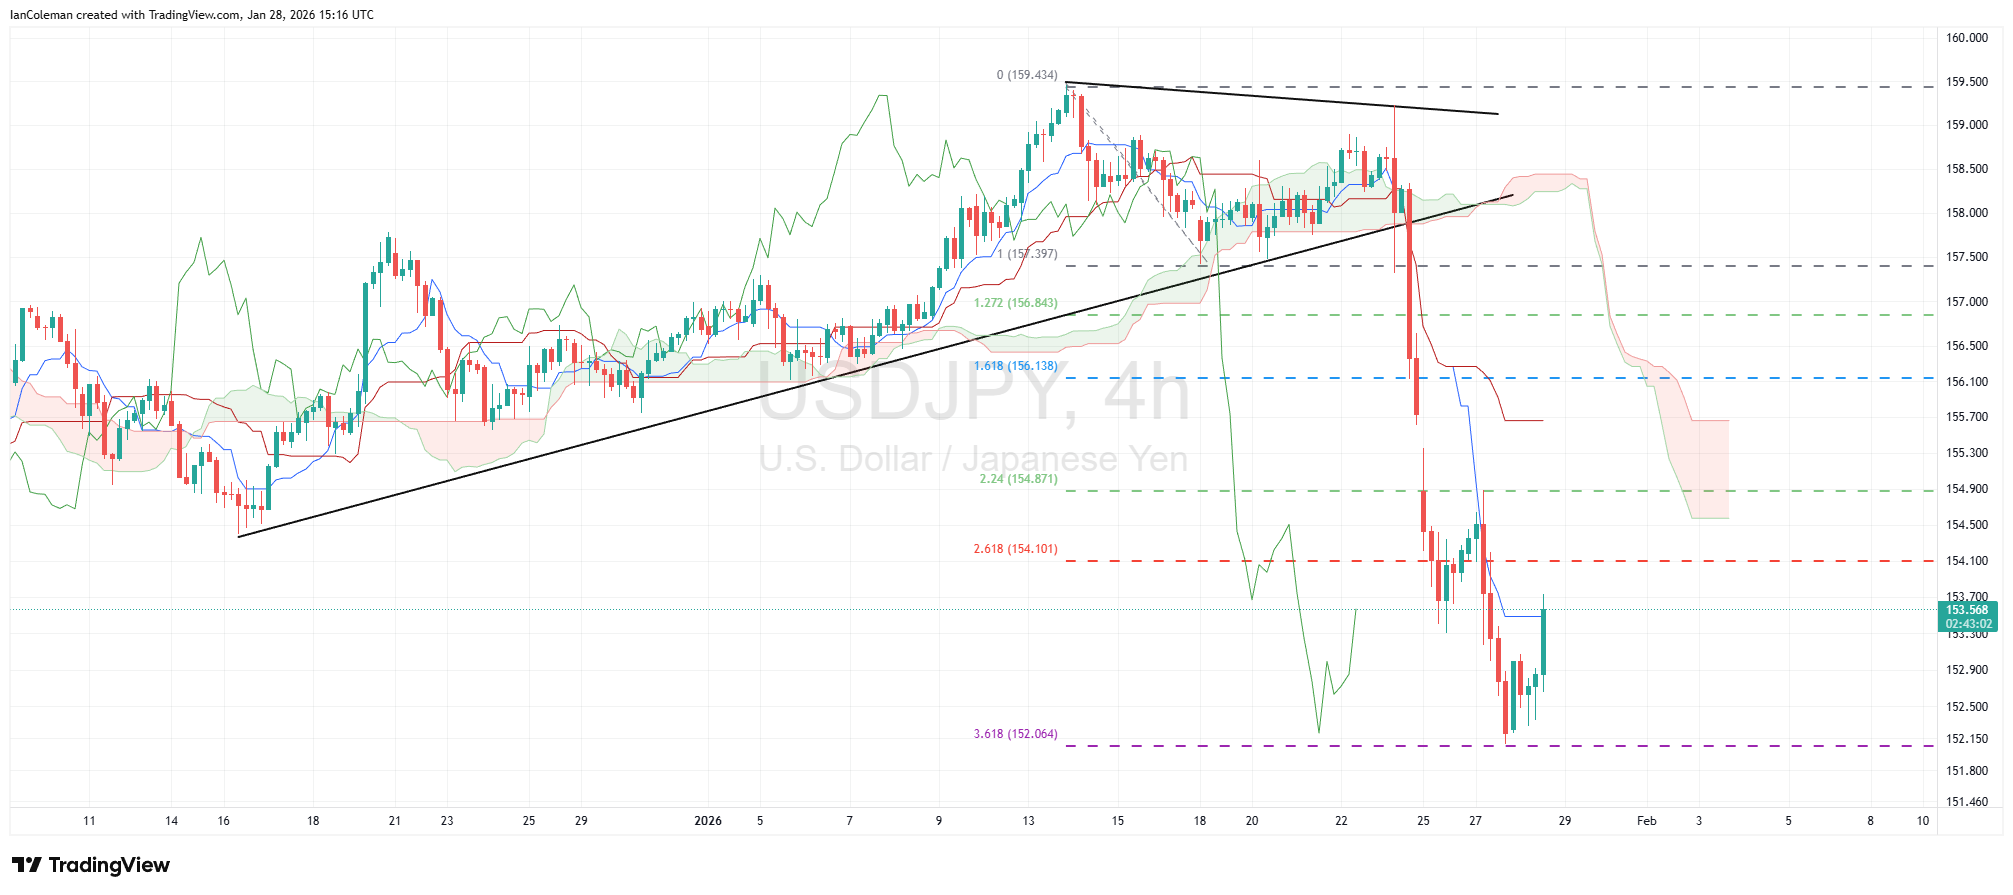
While the calculations behind the indicator’s components are important, the immediate focus is on understanding how the cloud behaves visually and how it frames market structure.
What the Ichimoku Cloud shows at a glance
The Ichimoku Cloud is designed to quickly reveal several key aspects of market behavior:
- Whether the market is trending or ranging
- Whether buyers or sellers are in control
- Whether the price is overextended or trading near fair value
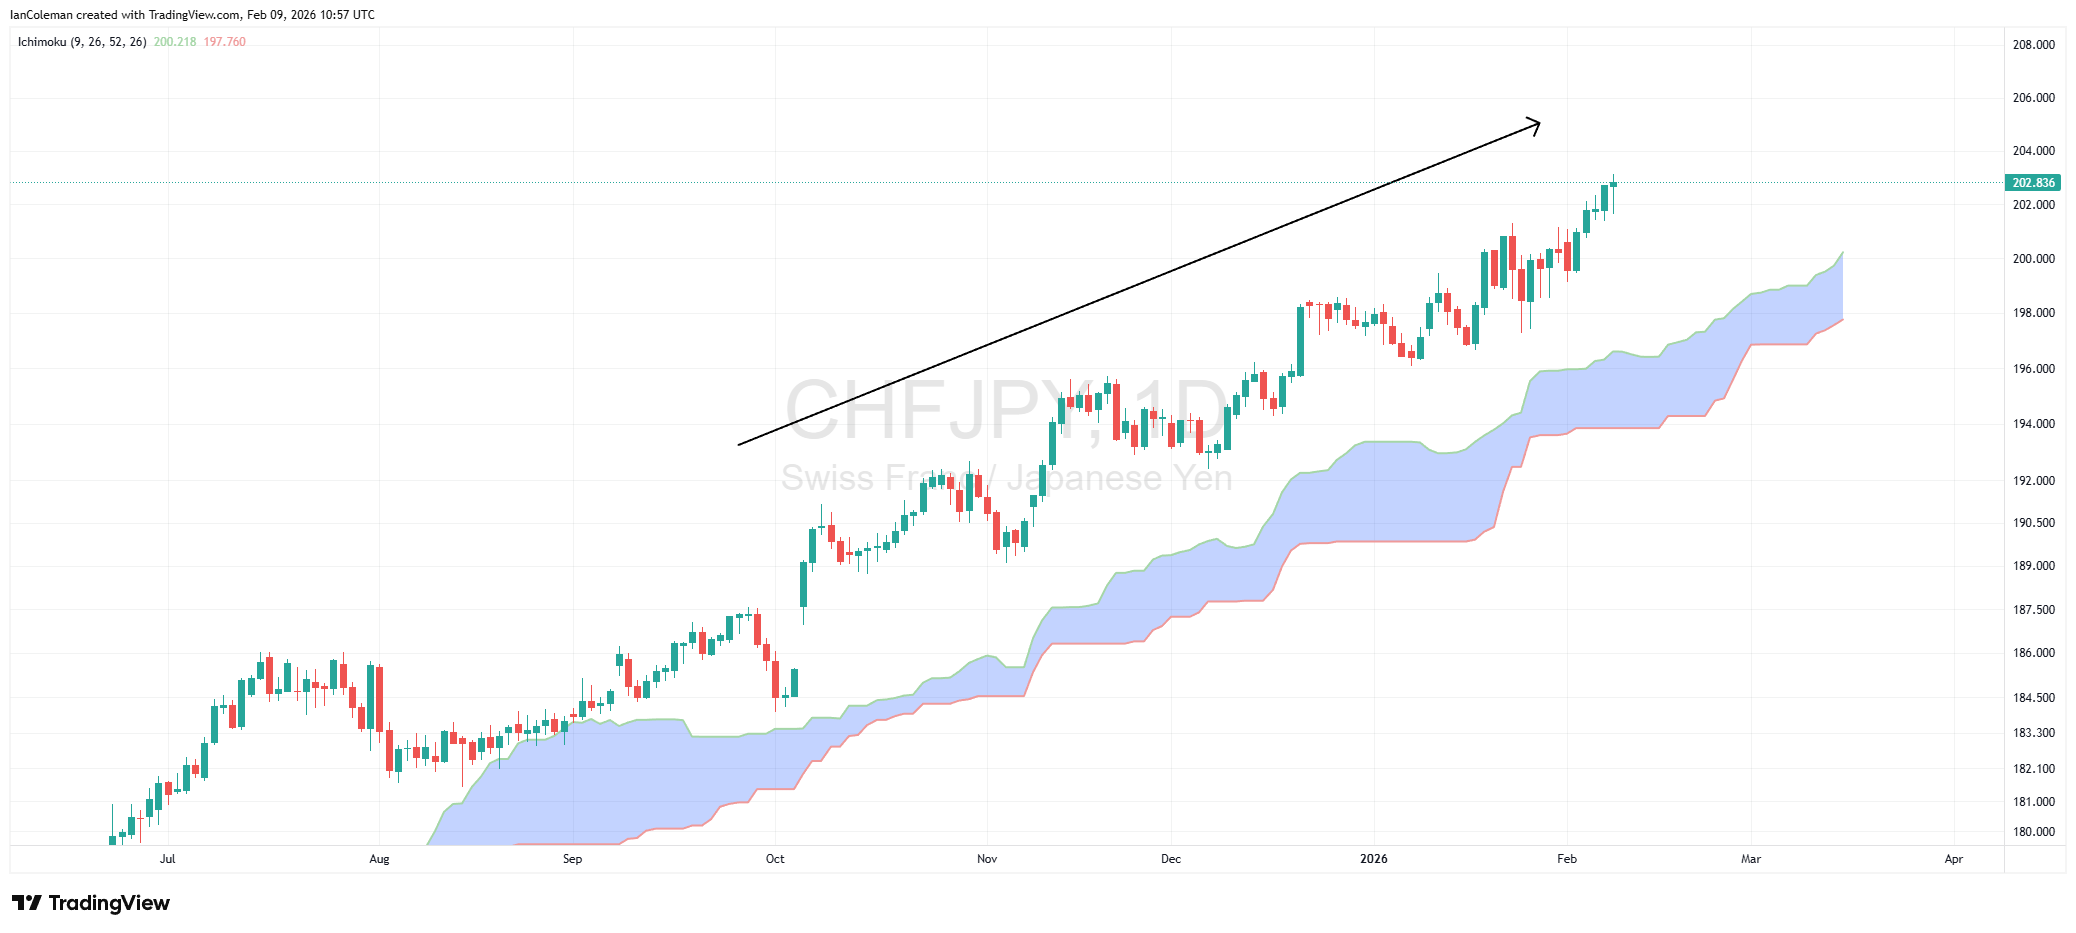
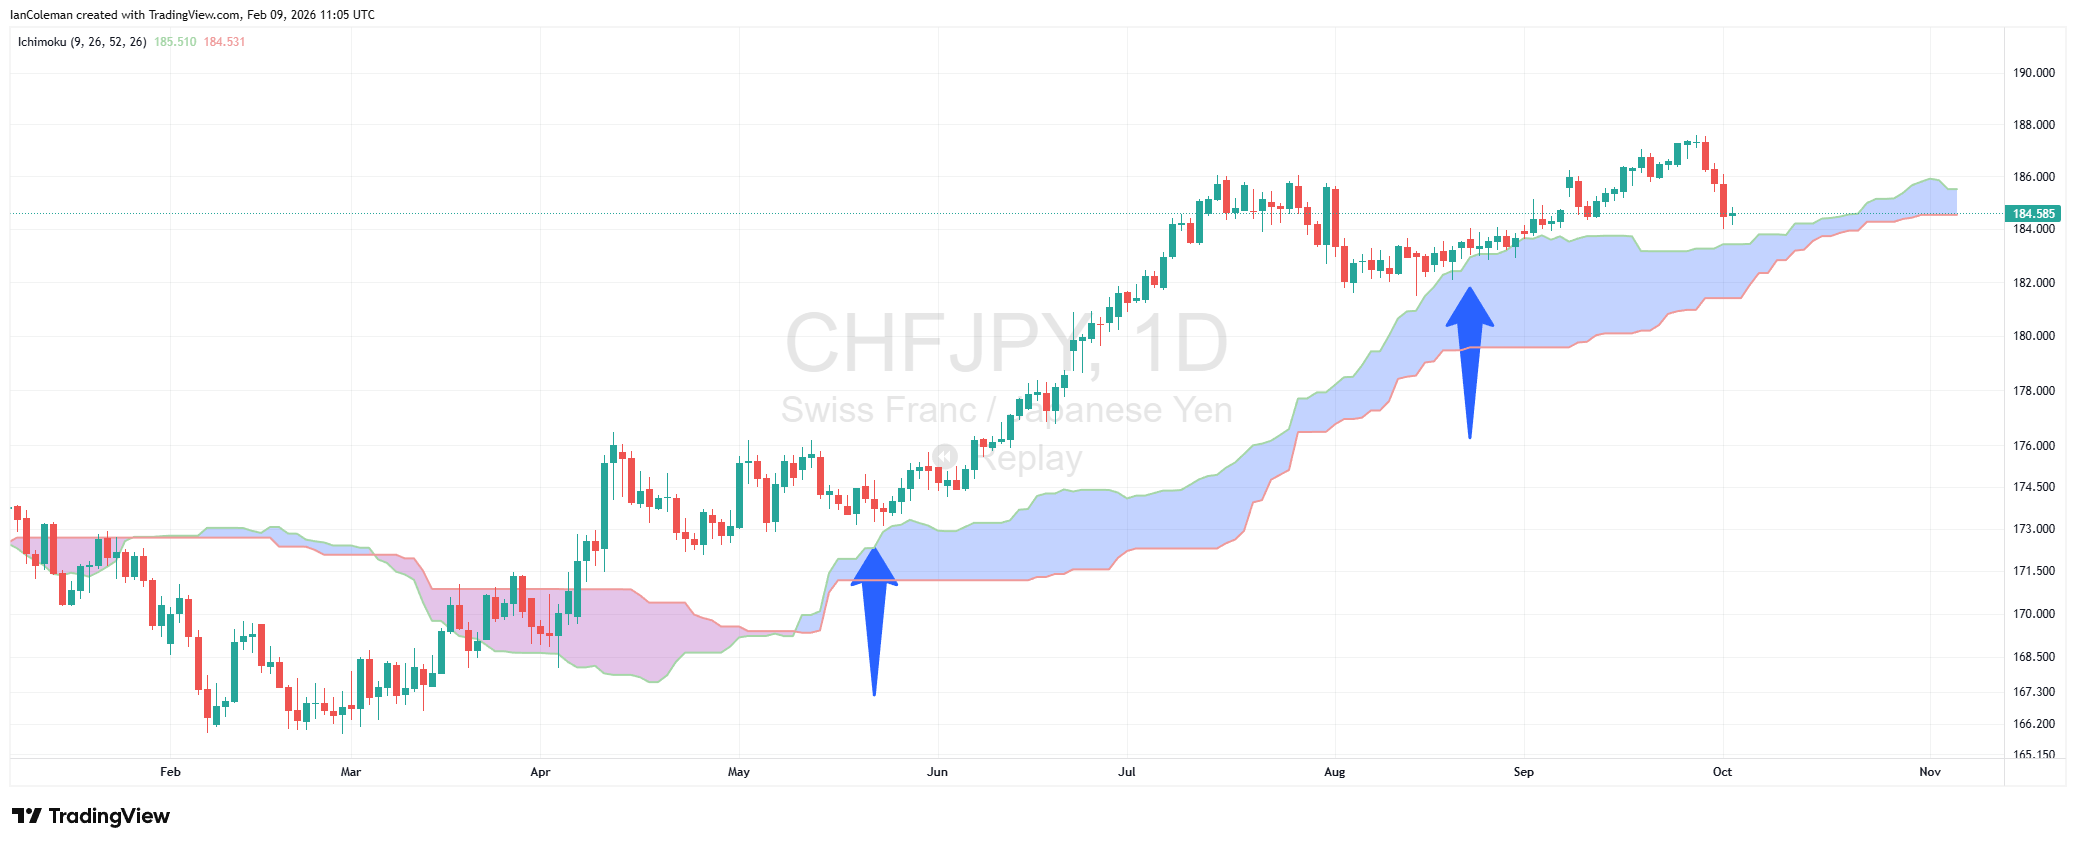
When price trades above a thick cloud base, the market is considered to be trending higher.
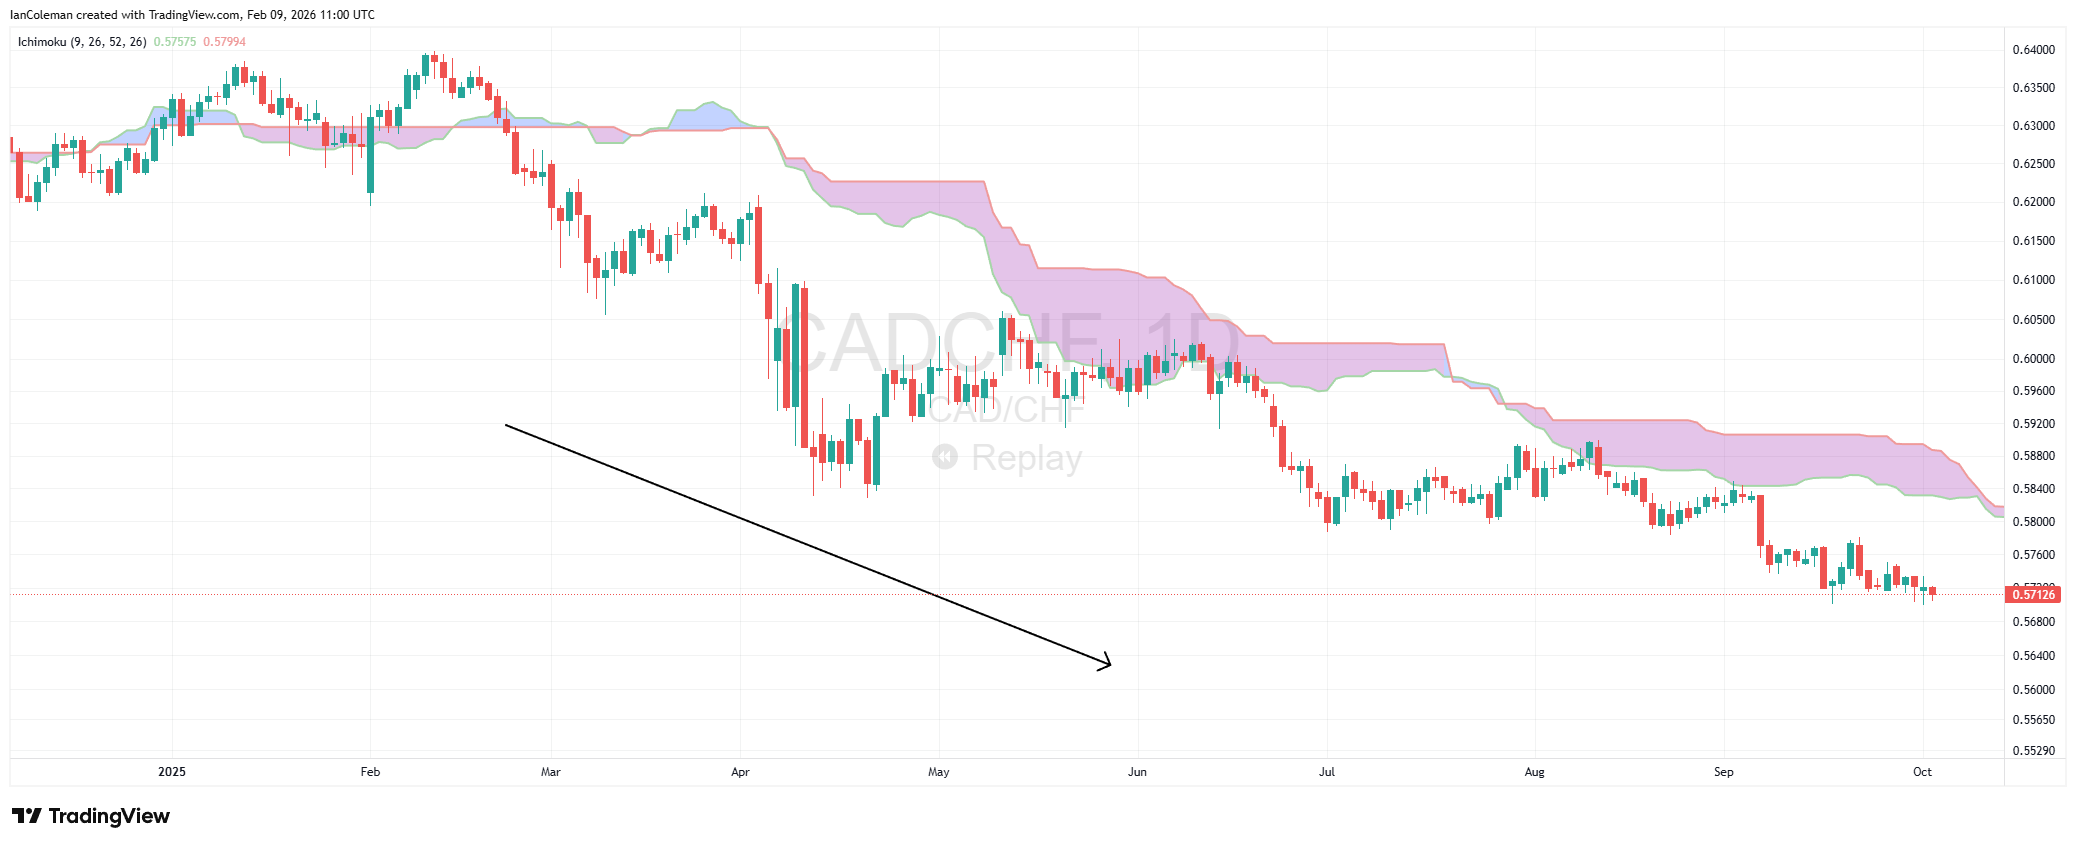
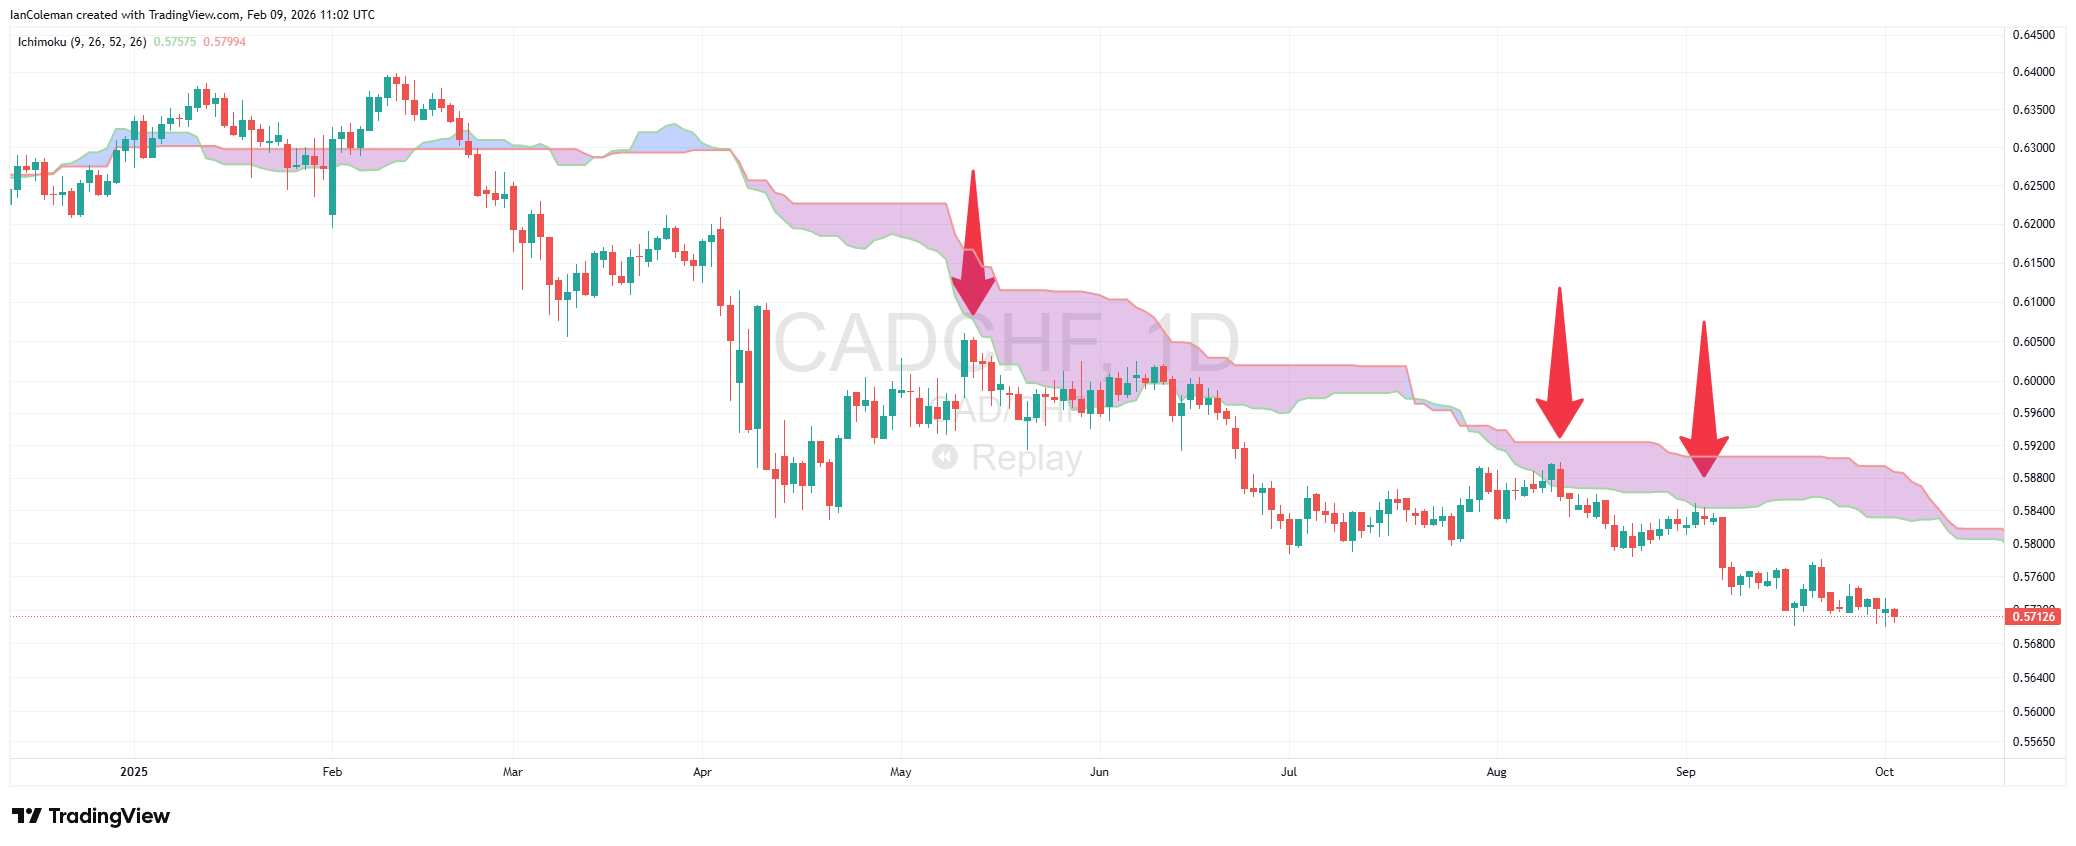
When price trades below a thick cloud cover, the market is considered to be trending lower.
If price pullbacks are being bought near the cloud, buyers remain in control.
If rallies are sold near the cloud, sellers remain in control.
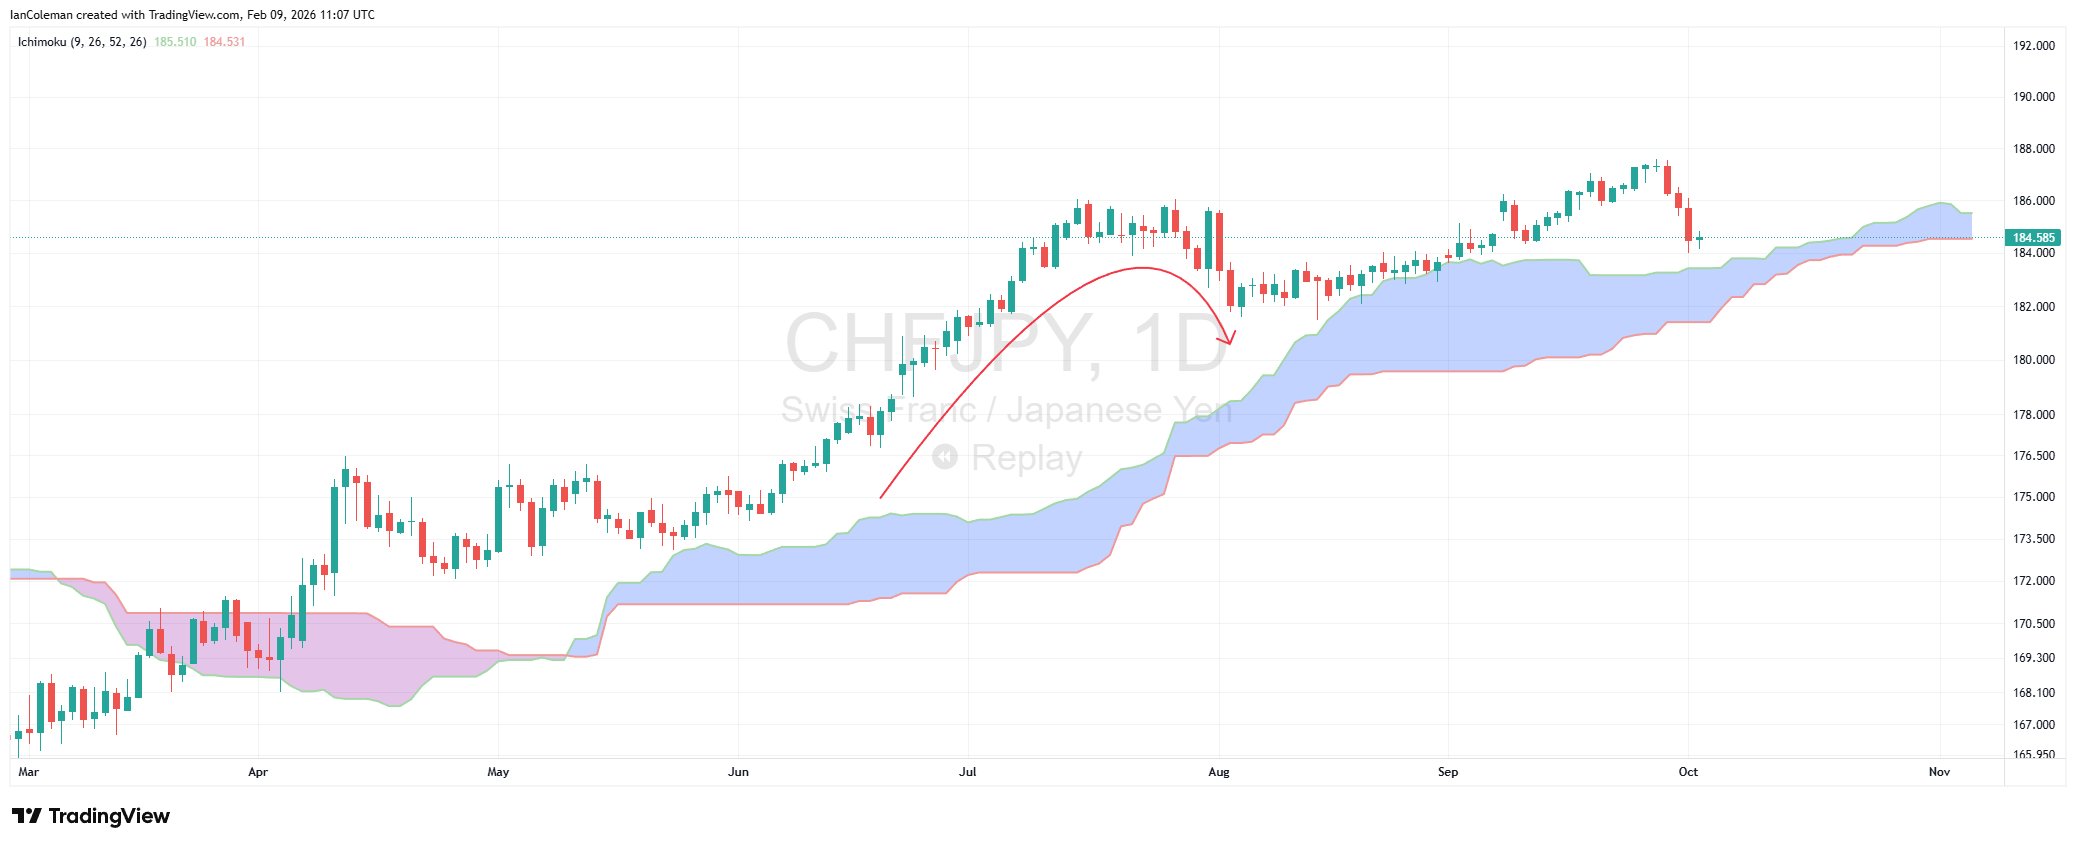
A strong move away from the cloud highlights that price is overextended, creating room for the cloud to catch up.
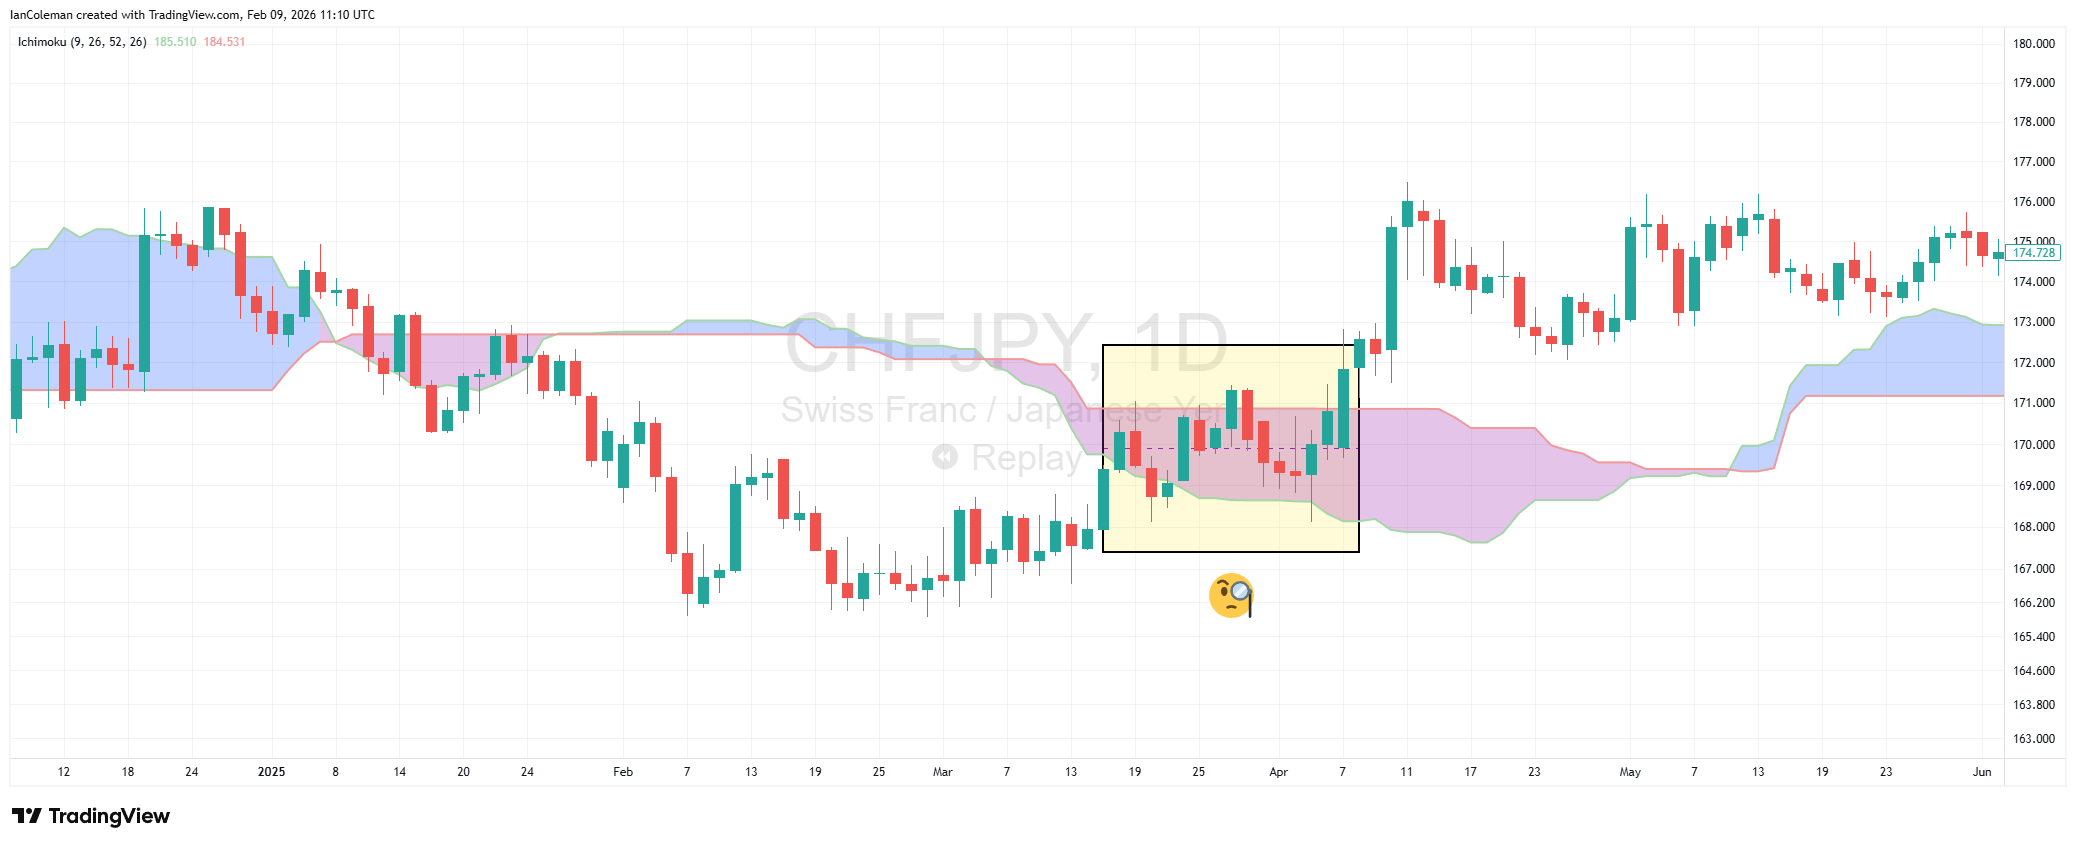
When price trades within the cloud, the market is considered trading at fair value.
Understanding the Kumo: The cloud structure
The cloud, also known as the Kumo, is formed by two boundaries: Senkou Span A and Senkou Span B. These levels are derived from calculations involving the Tenkan and Kijun lines.
A bullish cloud forms when Senkou Span A is above Senkou Span B, typically displayed as a blue cloud.
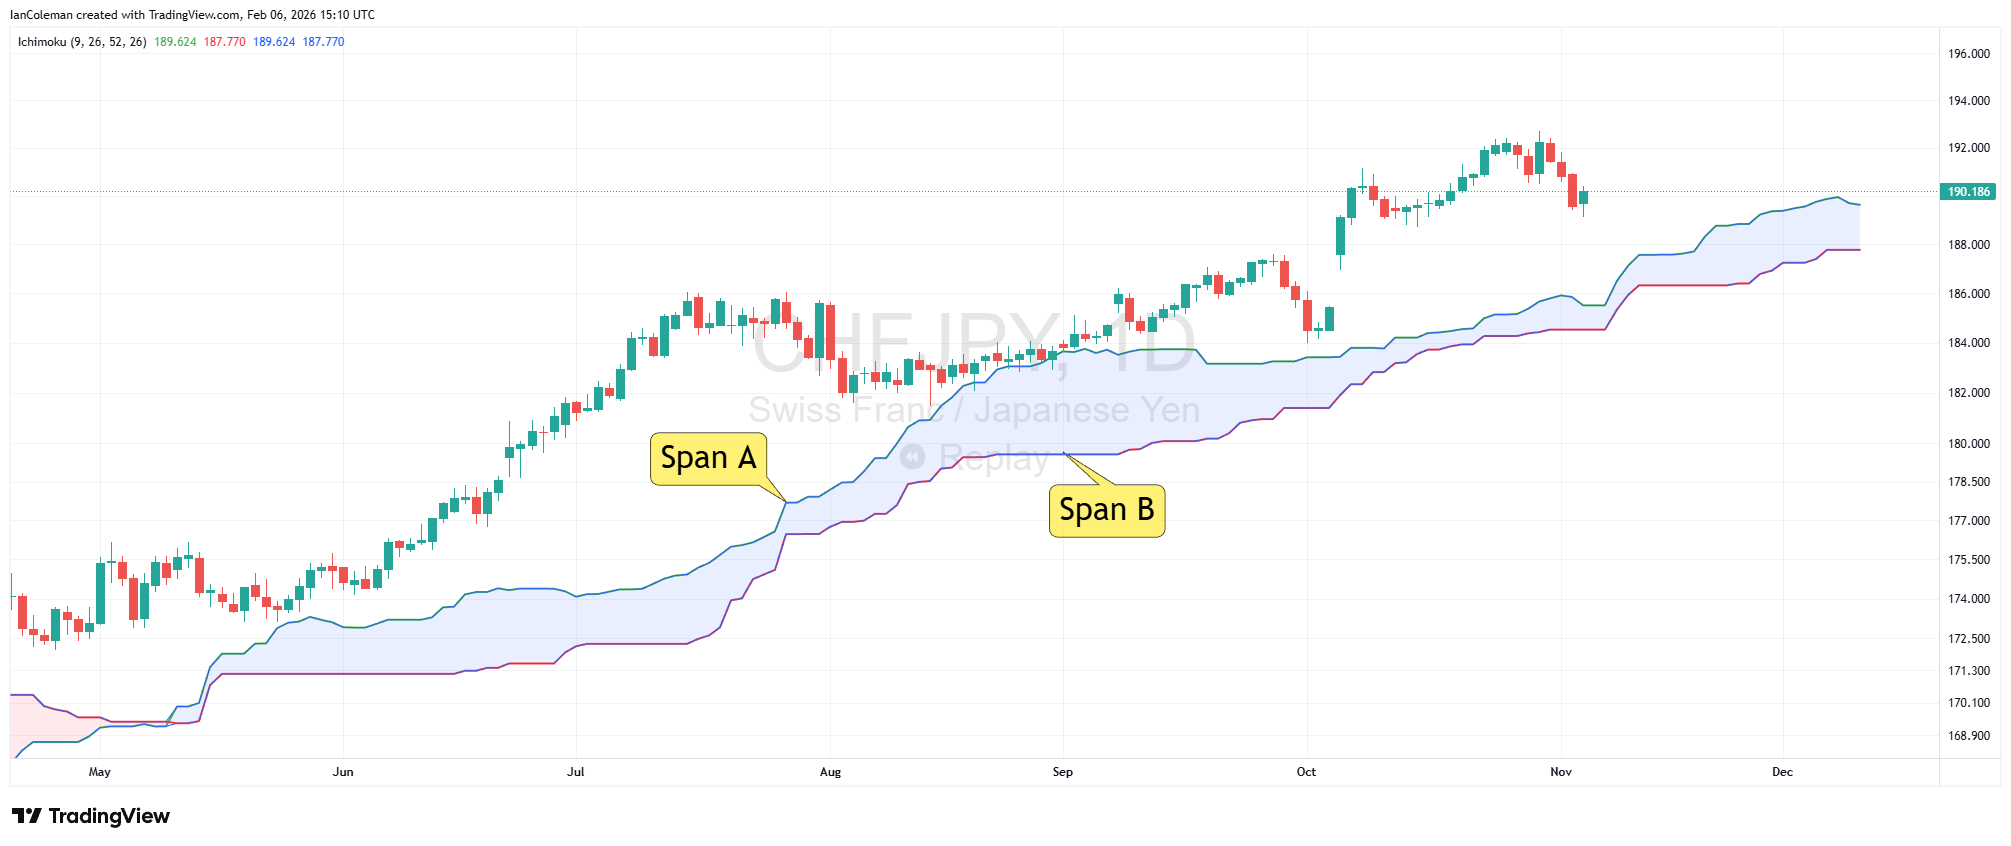
A bearish cloud forms when Senkou Span A is below Senkou Span B, typically displayed as a red cloud.
Span B, as the slower-moving boundary, often acts as a stronger and more reliable support or resistance level.
Forward-projected support, resistance, and trend bias
One of the defining characteristics of the Ichimoku Cloud is that it projects the cloud 26 periods into the future.
If the projected cloud remains red, it suggests the current bearish trend will likely continue. A shift to a bullish cloud acts as an early warning sign for sellers.
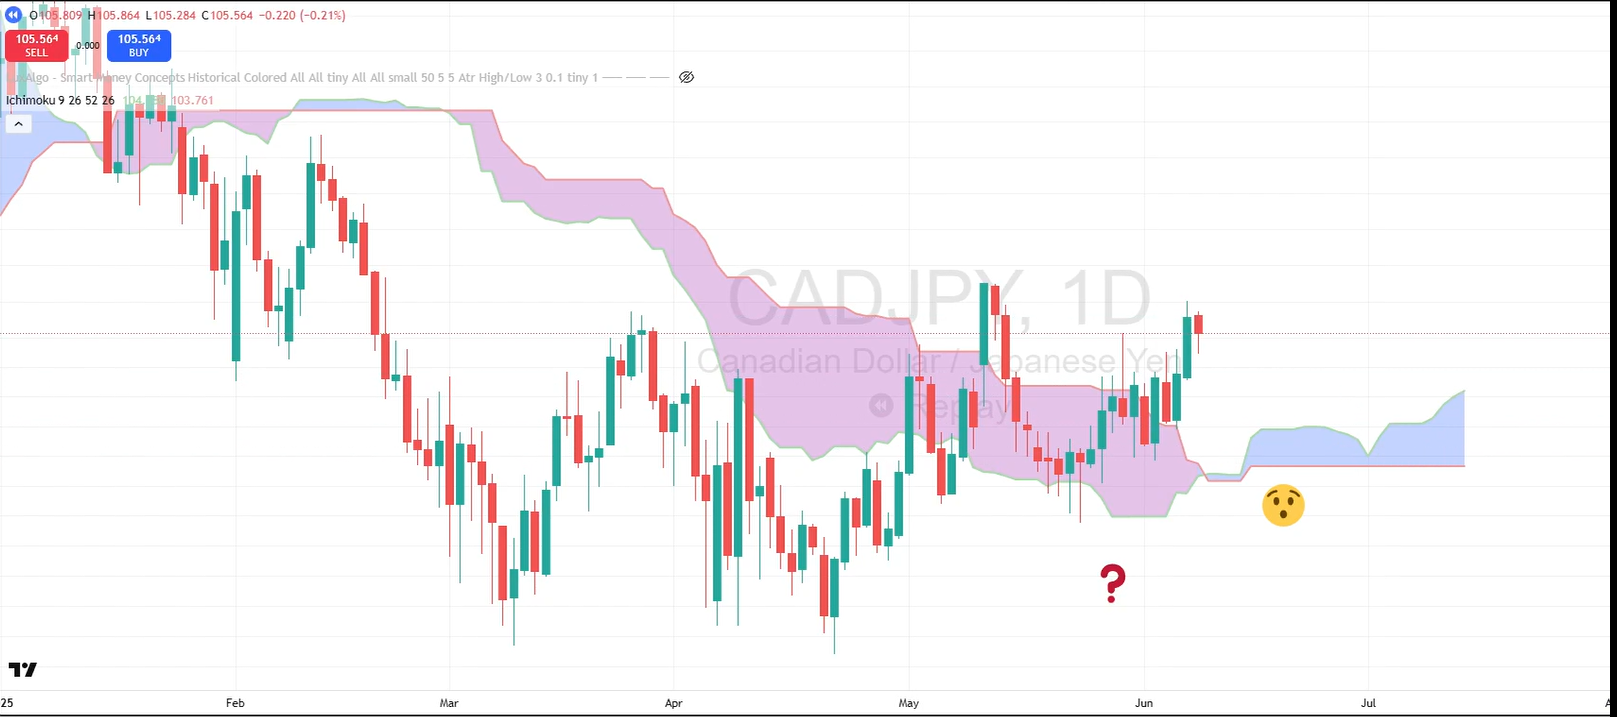
If the projected cloud remains green, it suggests that the current bullish trend should continue. A shift to a bearish cloud acts as a warning sign for buyers.
Using the Cloud as dynamic support and resistance
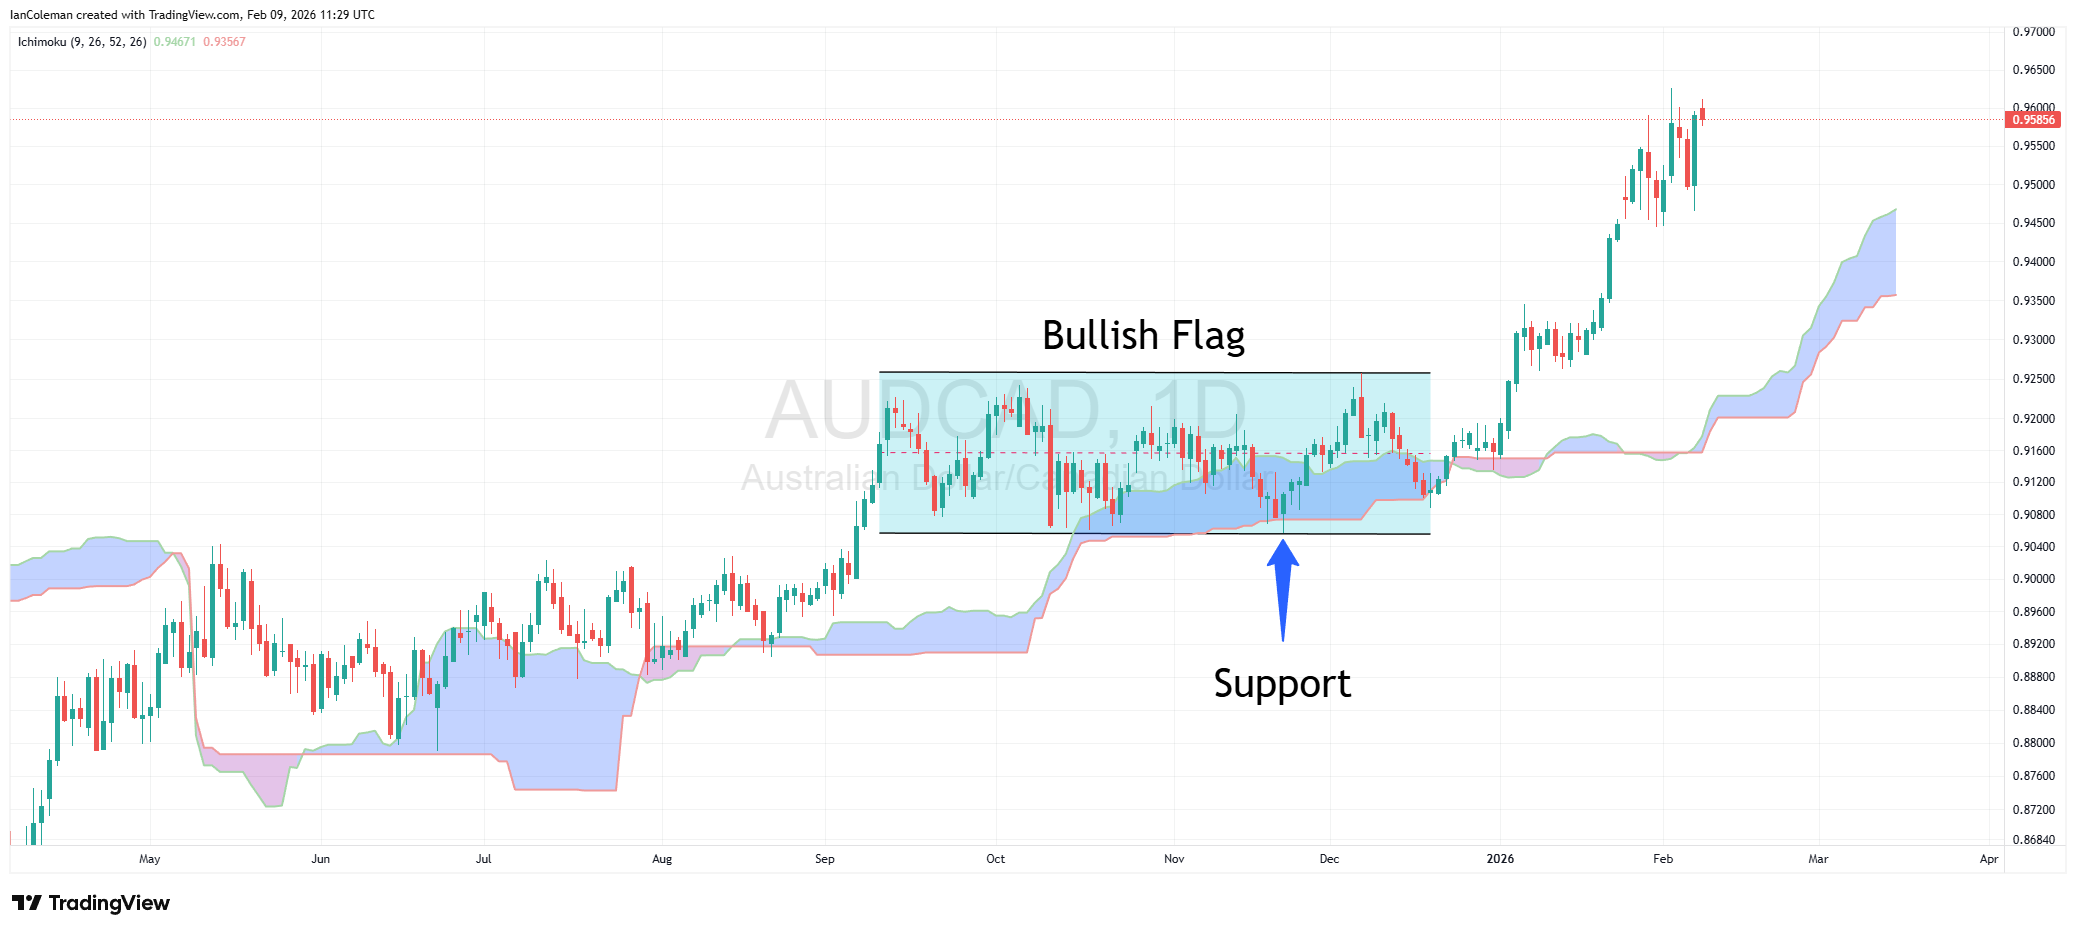
In its most basic application, both Senkou Span A and Senkou Span B can be treated as dynamic support and resistance levels. This makes the Ichimoku Cloud particularly useful for analyzing continuation patterns, such as flags and other consolidation structures.
Adding the lagging line to build a basic trading strategy
To construct a basic Ichimoku trading framework, we introduce one additional component: the lagging line.
The lagging line represents the current price projected 26 periods into the past. With this addition, the system now contains three core components, providing enough structure for a basic trend-following strategy.
A simple Ichimoku trend-following framework
In its most basic form, the Ichimoku Cloud trend-following trading strategy follows these principles:
- A red cloud, combined with a red cloud projected 26 periods forward, signals that only sell trades should be considered.
- The position of the lagging line relative to price 26 periods back confirms market structure.
- Trade execution is focused around Senkou Span A.
- The stop loss is placed on the opposite side of the trigger candle.
- A minimum reward-to-risk ratio of two-to-one is targeted.
This framework highlights how the Ichimoku Cloud functions as a structured trend-following system rather than a reversal-based indicator.
(This article has been written using the help of an AI tool.)
