

Short Trade Idea
Enter your short position between 299.17 (the lower band of its horizontal resistance level) and 313.62 (the lower band of its horizontal resistance level).
Market Index Analysis
- American Express (AXP) is a member of the Dow Jones Industrial Average, the S&P 100, and the S&P 500
- All three indices hover near records, but bearish conditions accumulate
- The Bull Bear Power Indicator of the S&P 500 shows a negative divergence
Market Sentiment Analysis
Equity markets took a breather to start the week. High-stakes talks between US President Trump and his Ukrainian counterpart failed to reassure investors about near-term changes. The release of minutes from the Federal Reserve on Wednesday, along with the Jackson Hole Economic Symposium, is a potential market mover. A light week on the economic front, with retail earnings on the horizon, may inject market volatility with their outlooks. Bank of America released a research note arguing for the end of mega-cap dominance, comparing the run to the pre-dot-com crash.
American Express Fundamental Analysis
American Express is the world’s fourth-largest card network based on purchase volume. It generally caters to more affluent consumers, and it is well-known for its rewards, exclusive offers, and partnership programs.
So, why am I bearish on AXP after its BNPL push?
American Express’s move into BNPL is slightly concerning, as it is a move away from its core consumer group to expand into lower-quality sectors. It could further destabilize the fragile balance sheet. The value destruction is ongoing, and the dismal average return on invested capital stands out to me. While AXP could successfully expand into BNPL, I believe the costs to its brand are too high.
American Express Fundamental Analysis Snapshot
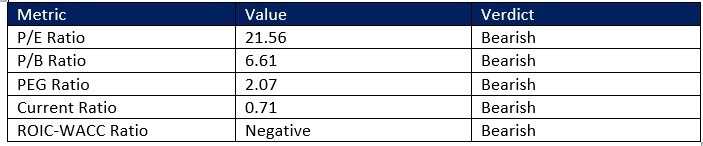
The price-to-earnings (P/E) ratio of 21.56 makes AXP an expensive stock for its sector. By comparison, the P/E ratio for the S&P 500 is 29.77.
The average analyst price target for AXP is 323.14. It suggests modest upside potential with magnified downside risks.
American Express Technical Analysis
Today’s AXP Signal
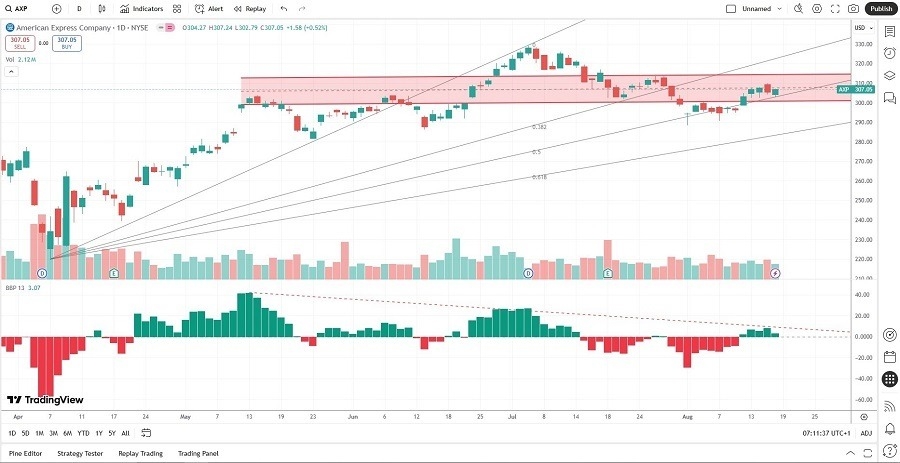
- The AXP D1 chart shows price action inside a horizontal resistance zone. A head-and-shoulder pattern is equally present
- It also shows price action challenging its ascending 50.0% Fibonacci Retracement Fan level
- The Bull Bear Power Indicator is bullish with a descending trendline, and it is approaching a bearish crossover
- The average bearish trading volumes are higher than the average bullish trading volumes
- AXP flatlined as the S&P 500 moved higher, a bearish trading signal
My Call
I am taking a short position in AXP between 299.17 and 313.62. The bearish conditions suggest a short-to-medium-term correction, fueled by high valuations, value destruction, and a shaky balance sheet that could struggle with the BNPL push.
- AXP Entry Level: Between 299.17 and 313.62
- AXP Take Profit: Between 239.27 and 257.21
- AXP Stop Loss: Between 320.12 and 329.14
- Risk/Reward Ratio: 2.86
Ready to trade our free daily signals? Here is our list of the best brokers for trading worth
