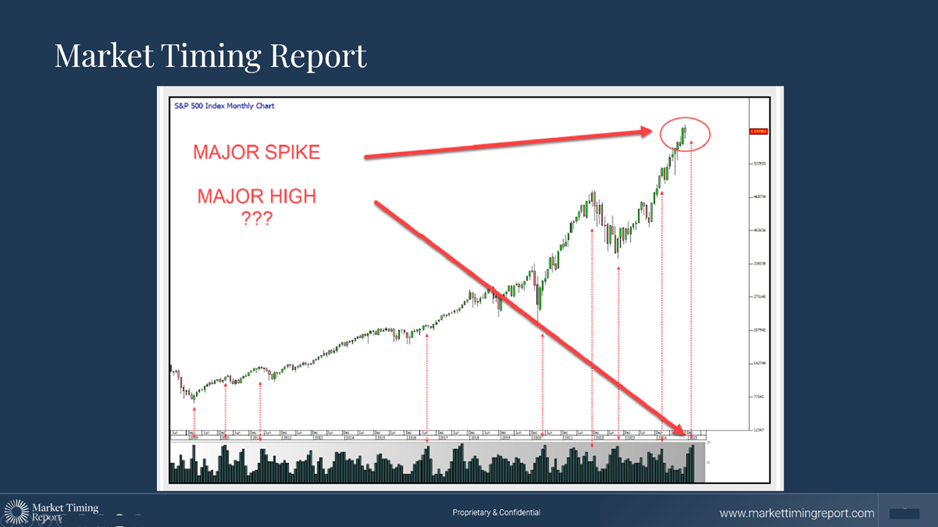
Back in November 2024, the American public were looking forward to a huge economic recovery based on the promises following the re-election of Donald Trump. People were poised for the Trump Bump. However, cycles were already telling a different story. The bull market was already nearly 15 years in from the major low following the 2007 global financial crisis. Important price targets were looming on the radar. Most importantly, little-known cycles were coming into play. Take a look at these charts.
Firstly, a key price target (one that we had been forewarning you about over several months) was rapidly approaching. This is shown in the first chart. Such an important target, for those of you who understand technical analysis, cannot be exceeded without a significant pullback, correction, or even crash. More importantly, take a look at this chart.
Below this monthly chart of the S&P 500 index, which goes back to 2008, you will see a series of histograms. When these histograms spike, we can expect changes in trend. They are based on market cycles interacting at a high level. If you take a close look, you will see how previous spikes have aligned with significant turning points.
The key benefit of these histogram spikes is that they are predictive—in other words, they are known in advance. As we approached December over the following weeks, we had a very large spike in front of us. This put us on alert for a major trend change.
At the bottom left, you can also see that such a spike identified the beginning of the bull market in 2009. Sentiment at that time was incredibly bearish, with the world having just lived through the global financial crisis.
Sentiment at the time of Trump’s re-election was incredibly bullish.
This bull market had effectively been running since 2009, following the end of the global financial crisis. With the exception of the short pullback in early 2020 (the one that tied in with a 90-year cycle to within six weeks), most people under the age of 35 have not witnessed a proper bear market. That includes some of our professional portfolio manager friends at some of the largest funds in the world.
The purpose of these histograms, and the entire timing system, is to get the odds on your side. This spike is putting us on alert. It does not necessarily forecast a crash. This enabled our followers to take advantage of what not only lay ahead, but also what is coming up next. We are now looking at key price targets, combined with cycles, to provide us with the next opportunity.


