

- AUD/USD snapped five consecutive days of gains, returning below 0.6500.
- The US Dollar gained a strong upside impulse following a sharp sell-off in the Yen.
- The Australian Current Account deficit narrowed a tad to A$13.7 billion in Q2.
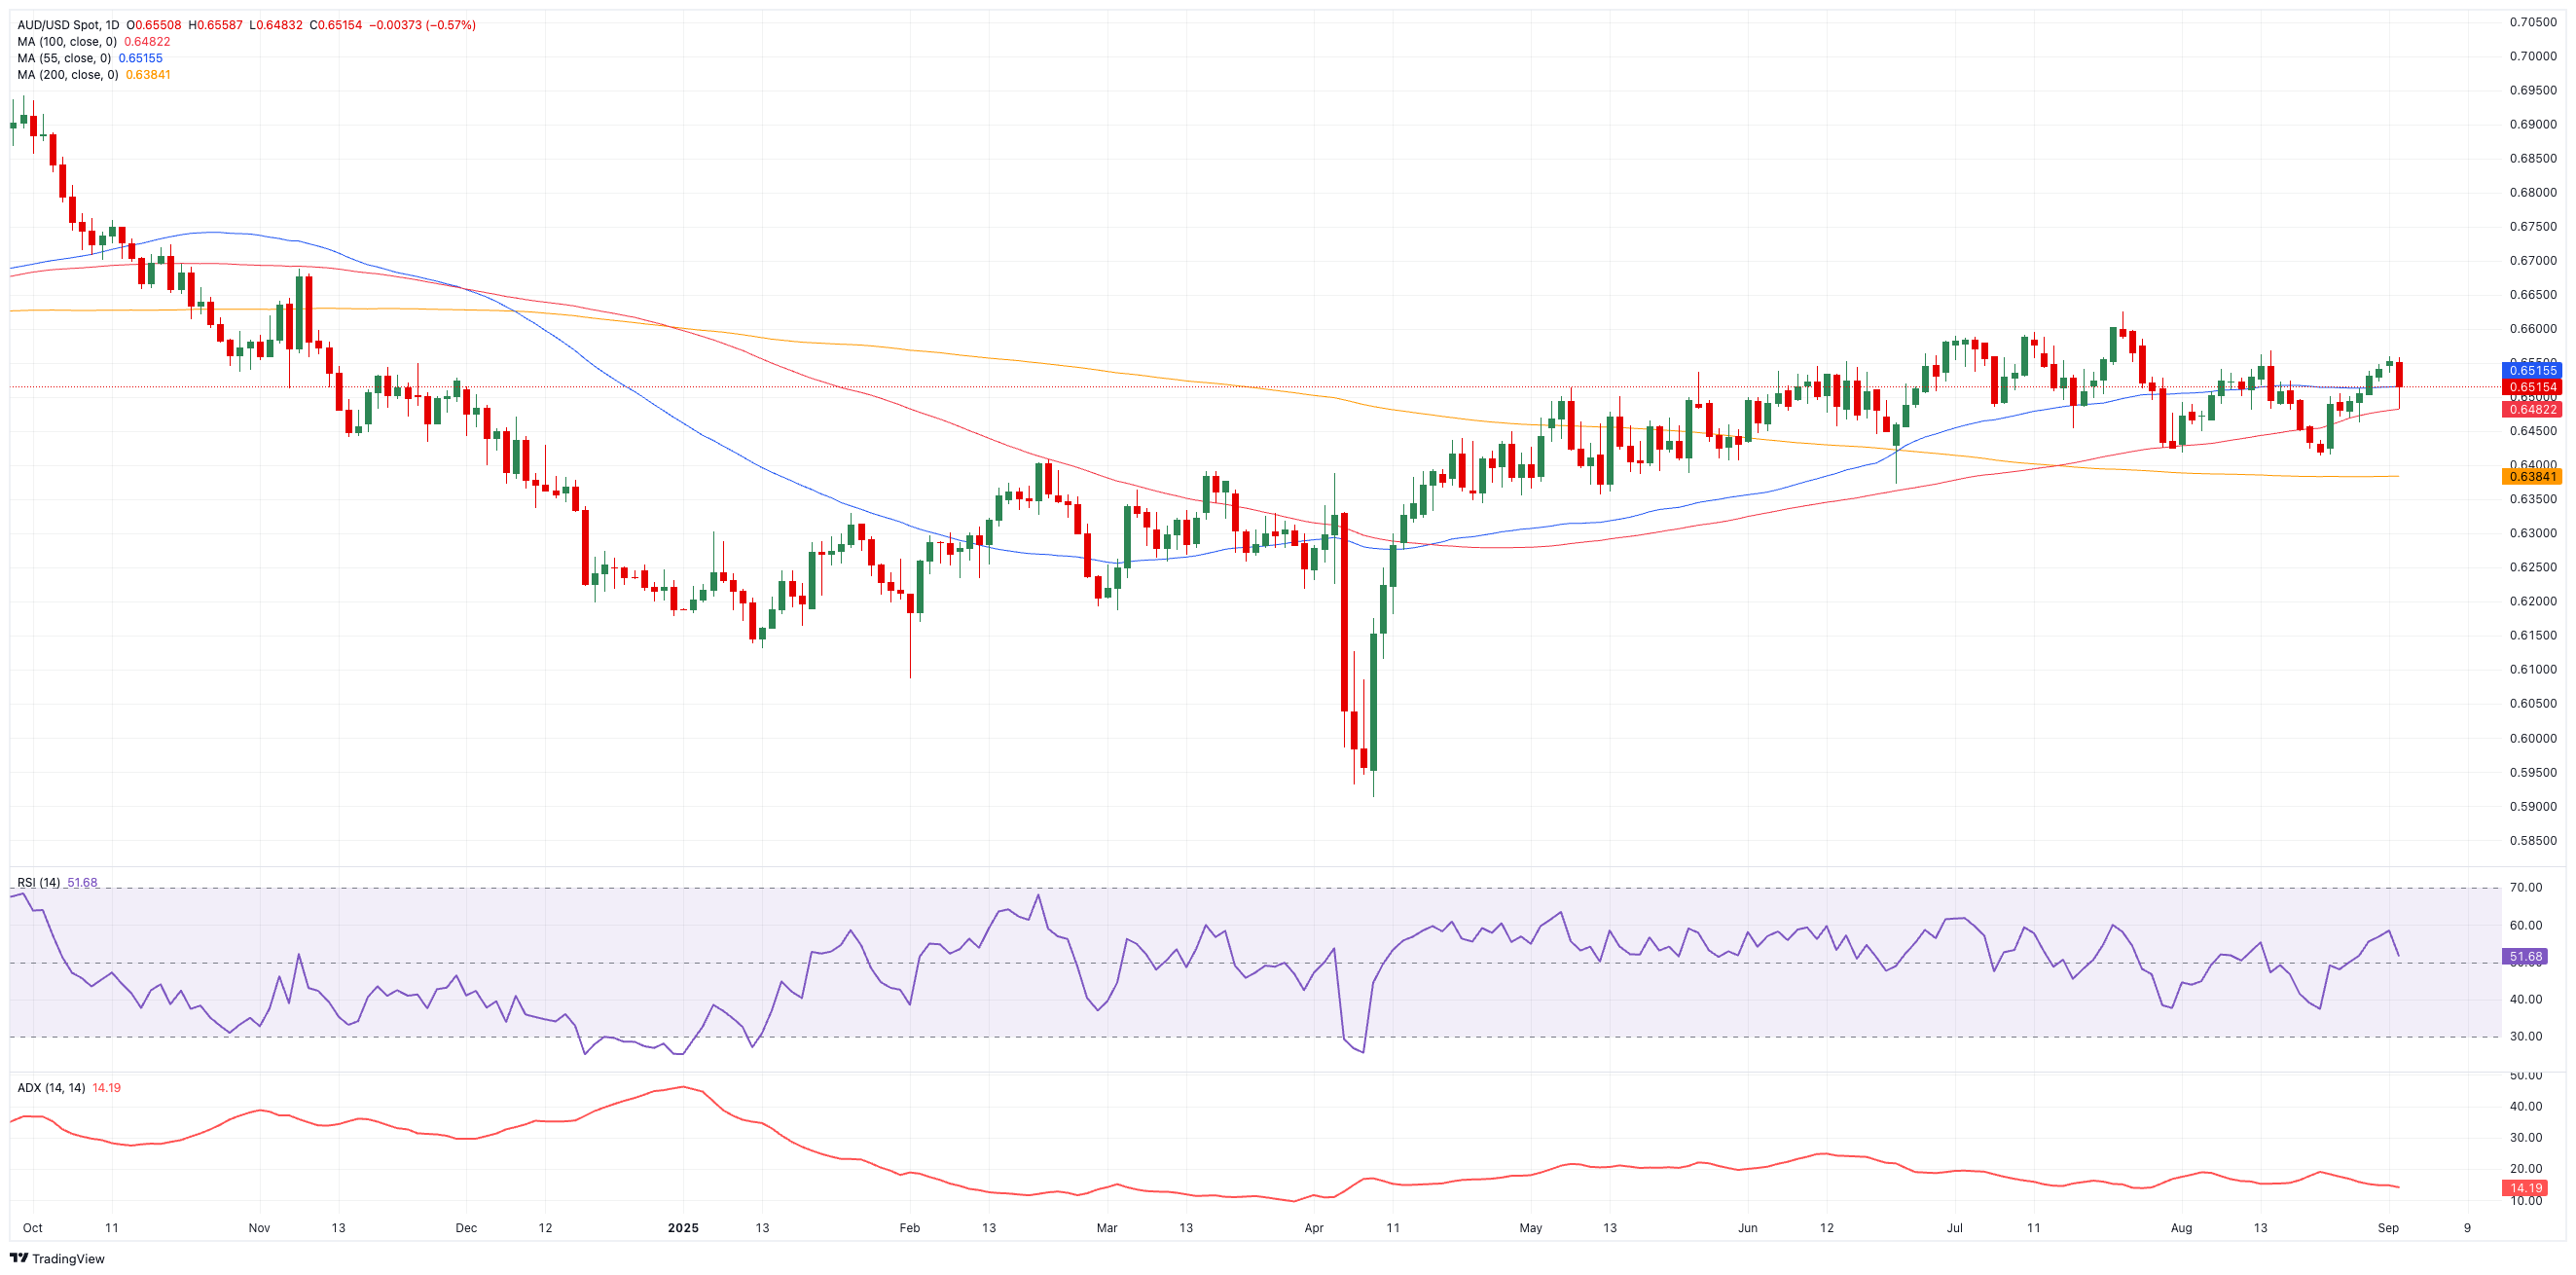
The Australian Dollar (AUD) gave back some of its recent gains against the US Dollar (USD) on Tuesday, with AUD/USD falling back to retest the 0.6480 zone, its lowest in days, while leaning on its temporary 100-day SMA.
The pullback came as the Greenback picked up fresh strength, helped by renewed selling in the Japanese Yen (JPY) after dovish comments from a Bank of Japan (BoJ) official.
Australia’s inflation is still running hot
July’s Monthly CPI Indicator (Weighted Mean) climbed to 2.8% from 1.9% in June. Q2 CPI rose 0.7% on the quarter and 2.1% over the last twelve months, keeping inflation concerns alive and backing the Reserve Bank of Australia’s (RBA) cautious tone.
Stronger data paints a resilient picture
The economic backdrop looks upbeat. August’s final Manufacturing PMI came in at 53.0, while services are expected at 55.1. Retail sales jumped 1.2% in June, and the trade surplus widened to A$5.365B. Jobs data also impressed, with unemployment easing to 4.2% as employment rose by 24.5K.
Private Capital Expenditure added 0.2% in Q2, underlining steady investment in structures and equipment.
RBA warns it’s still data-dependent
The RBA cut rates by 25 basis points earlier this month to 3.60% and trimmed its 2025 growth outlook. Governor Michele Bullock pushed back against calls for deeper cuts, stressing that the policy remains “data-dependent”.
Markets are anticipating another quarter percentage point cut by November 5, while the latest Minutes suggested that faster easing could occur if the labour market weakens; however, a slower pace is expected if conditions remain tight.
China’s uneven recovery remains key
China’s economy continues to provide conflicting signals. Q2 GDP grew 5.2% YoY, and industrial output rose 7%, but retail sales disappointed. August PMIs were split, with manufacturing at 49.4 and services up slightly to 50.3. The trade surplus narrowed, while inflation was flat.
The People’s Bank of China (PBoC) left its One-Year and Five-Year Loan Prime Rates (LPR) unchanged last month, in line with expectations.
Speculators pile into Aussie shorts
Commodity Futures Trading Commission (CFTC) data showed net speculative shorts in AUD climbing back to April 2024 levels at around 100.6K contracts for the week ending August 26. In addition, open interest also increased for the fourth week running, now close to 191.2K contracts.
AUD/USD technical outlook: Rangebound trade holds
For now, AUD/USD remains stuck in its 0.6400–0.6600 range. On the upside, resistance comes first at the weekly high of 0.6568 (August 14), then the 2025 ceiling at 0.6625 (July 24). Clearing that area could open the way to the November 2024 peak at 0.6687 (November 7), with the psychological 0.7000 mark further out.
Southwards, support sits at 0.6414 (August 21). A break lower would put the 200-day SMA at 0.6385 in view, just ahead of the June floor at 0.6372 (June 23).
Momentum indicators paint a mixed picture, with the Relative Strength Index (RSI) slipping back toward 52 signalling some shrinking buying conviction, and the Average Directional Index (ADX) slipping back under 14 pointing to a still weak trend.
AUD/USD daily chart
Outlook: Stuck in a range until the next catalyst
Without a clear driver, whether stronger Chinese data, a Fed shift, or an RBA surprise, AUD/USD looks set to keep drifting within its current consolidative phase.
US-China Trade War FAQs
Generally speaking, a trade war is an economic conflict between two or more countries due to extreme protectionism on one end. It implies the creation of trade barriers, such as tariffs, which result in counter-barriers, escalating import costs, and hence the cost of living.
An economic conflict between the United States (US) and China began early in 2018, when President Donald Trump set trade barriers on China, claiming unfair commercial practices and intellectual property theft from the Asian giant. China took retaliatory action, imposing tariffs on multiple US goods, such as automobiles and soybeans. Tensions escalated until the two countries signed the US-China Phase One trade deal in January 2020. The agreement required structural reforms and other changes to China’s economic and trade regime and pretended to restore stability and trust between the two nations. However, the Coronavirus pandemic took the focus out of the conflict. Yet, it is worth mentioning that President Joe Biden, who took office after Trump, kept tariffs in place and even added some additional levies.
The return of Donald Trump to the White House as the 47th US President has sparked a fresh wave of tensions between the two countries. During the 2024 election campaign, Trump pledged to impose 60% tariffs on China once he returned to office, which he did on January 20, 2025. With Trump back, the US-China trade war is meant to resume where it was left, with tit-for-tat policies affecting the global economic landscape amid disruptions in global supply chains, resulting in a reduction in spending, particularly investment, and directly feeding into the Consumer Price Index inflation.
