

Short Trade Idea
Enter your short position between $141.52 (the intra-day low of its last bearish candle) and $150.73 (the mid-range of its horizontal resistance zone).
Market Index Analysis
- Shopify (SHOP) is a member of the NASDAQ 100.
- This index trades near all-time highs without volume confirmation.
- The Bull Bear Power Indicator for the NASDAQ 100 shows a negative divergence and does not confirm the uptrend.
Market Sentiment Analysis
Equity markets continue to climb a wall of worry fueled by hopes that interest rate cuts by the Federal Reserve will suffice to reverse the sliding job market and spur capital inflows from money market funds, where over $7 trillion earn reasonable risk-free returns. The Senate confirmed President Trump’s Fed Governor pick Miran, while the SEC vows to fast-track the president’s push to end quarterly financial reports by publicly listed companies. Cautious bullish sentiment prevails as markets ignore the headwinds.
Shopify Fundamental Analysis
Shopify is a leading e-commerce platform with nearly 60% of its business in the US. It is known as the go-to e-commerce platform for startups due to its fair fee structure and user-friendly platform.
So, why am I bearish on SHOP despite its 50%+ rally?
The departure of its COO, the excessive valuations, which are higher than AI stocks, and the capital-intensive push into the gaming and technology sectors pose medium-term challenges. SHOP began to behave more like meme stocks, with 25 trading days over the trailing twelve months experiencing moves exceeding 5%. Until more clarity emerges about its future identity, I see a price action reversal ahead.
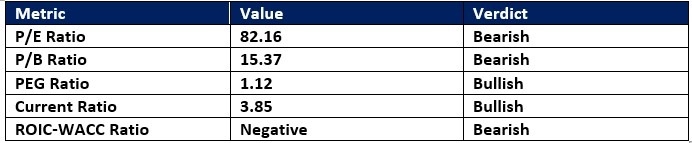
Shopify Fundamental Analysis Snapshot
The price-to-earning (P/E) ratio of 82.16 makes SHOP an expensive stock. By comparison, the P/E ratio for the NASDAQ 100 is 33.56.
The average analyst price target for SHOP is $161.11. It suggests moderate upside potential as downside risks dominate.
Shopify Technical Analysis
Today’s SHOP Signal
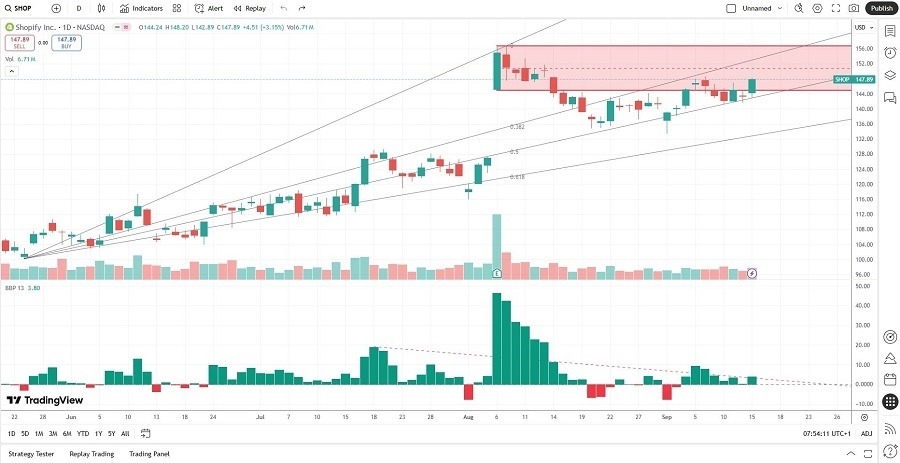
Shopify Price Chart
- The SHOP D1 chart shows price action inside its horizontal resistance zone.
- It also shows price action between its ascending 38.2% and 50.0% Fibonacci Retracement Fan levels.
- The Bull Bear Power Indicator is bullish with a descending trendline.
- The average bearish trading volumes are higher than the average bullish trading volumes.
- SHOP corrected as the NASDAQ 100 powered ahead, a significant bearish signal.
My Call on Shopify
I am taking a short position in SHOP between $141.52 and $150.73. The high valuations and loss of its COO pose fundamental headwinds. SHOP destroys shareholder value as the return on invested capital (ROIC) is below the cost of capital (WACC), and it issues more shares to finance operations. I am shorting this quasi-meme stock at resistance.
- SHOP Entry Level: Between $141.52 and $150.73
- SHOP Take Profit: Between $100.31 and $111.39
- SHOP Stop Loss: Between $161.11 and $165.94
- Risk/Reward Ratio: 2.10
Ready to trade our free daily signals? Here is our list of the best brokers for trading worth checking out.
