

Long Trade Idea
Enter your long position between $211.03 (the lower band of its horizontal support zone) and $216.10 (the upper band of its horizontal support zone).
Market Index Analysis
- Amazon.com (AMZN) is a member of the NASDAQ 100, the Dow Jones Industrial Average, the S&P 100, and the S&P 500 index.
- All four indices are currently trading near all-time highs amid prevailing bearish signals.
- The Bull Bear Power Indicator of the NASDAQ 100 shows a negative divergence and does not confirm the uptrend.
Market Sentiment Analysis
Equity markets pushed higher yesterday, but futures trade lower this morning. Still, investors hope that the third-quarter earnings season will keep the AI bubble alive. Positive comments about the potential end of the government shutdown as soon as this week added to bullish sentiment. President Trump noted expectations to reach a fair deal with President Xi next week, but he keeps the pressure high by striking deals with regional partners of China.
Amazon.com Fundamental Analysis
Amazon.com is one of the Big Five US technology companies and a leader in the global AI race and cloud computing sector. It has excellent profit margins, but its debt remains excessive. AMZN is an industry disruptor but faces stiff competition from China.
So, why am I bullish on AMZN ahead of its earnings release?
AMZN continues to diversify its revenue streams. I buy into the launch of its private label grocery store, its recent partnership with WeightWatchers to deliver medication, and the financial backing of an electric aircraft IPO. AMZN remains a leader in AI, cloud computing, and e-commerce, and its current valuations trade well below its five-year average.
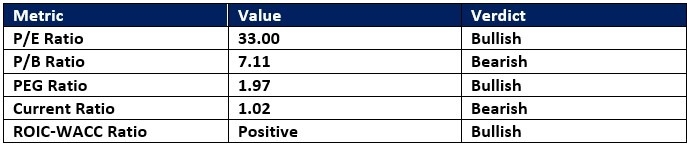
Amazon.com Fundamental Analysis Snapshot
The price-to-earning (P/E) ratio of 33.00 makes AMZN an inexpensive stock. By comparison, the P/E ratio for the NASDAQ 100 is 38.08.
The average analyst price target for AMZN is $266.56. It suggests good upside potential with acceptable downside risks.
Amazon.com Technical Analysis
Today’s AMZN Signal
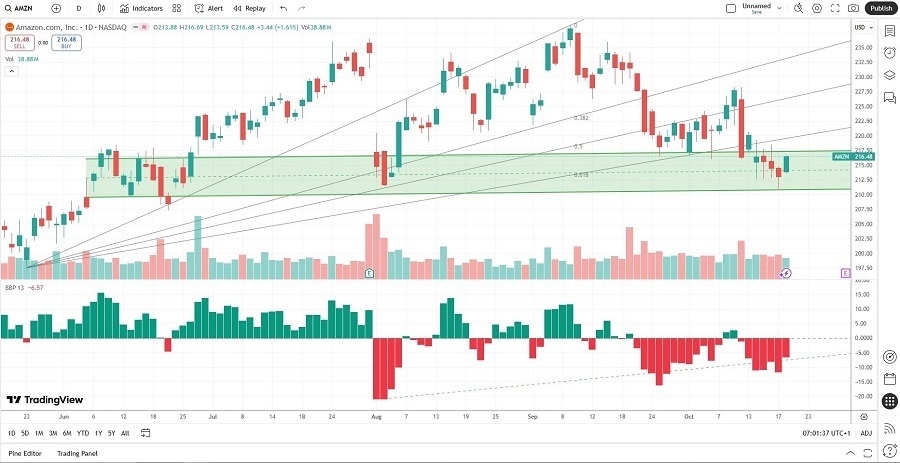
Amazon Price Chart
- The AMZN D1 chart shows price action inside a horizontal support zone.
- It also shows price action below its ascending Fibonacci Retracement Fan.
- The Bull Bear Power Indicator is bearish with an ascending trendline.
- The average bullish trading volumes are higher than the bearish trading volumes.
- AMZN corrected as the S&P 500, a bearish development, but breakout catalysts have accumulated.
My Call on Amazon
I am taking a long position in AMZN between $211.03 and $216.10. I am bullish on its earnings release and guidance, which will be released on October 30th, 2025. Valuations are low, and AMZ gains momentum in cloud services.
- AMZN Entry Level: Between $211.03 and $216.10
- AMZN Take Profit: Between $253.23 and $266.56
- AMZN Stop Loss: Between $194.69 and $202.37
- Risk/Reward Ratio: 2.58
Ready to trade our free stock signals? Here is our list of the best stock brokers worth checking out.
