

XAU/USD Current price: $3,571.87
- Softer-than-anticipated US employment data put pressure on the Greenback.
- The US will publish the ADP Employment Change report and the Services PMI on Thursday.
- XAU/USD keeps rallying in unexplored territory, bulls looking for higher highs.
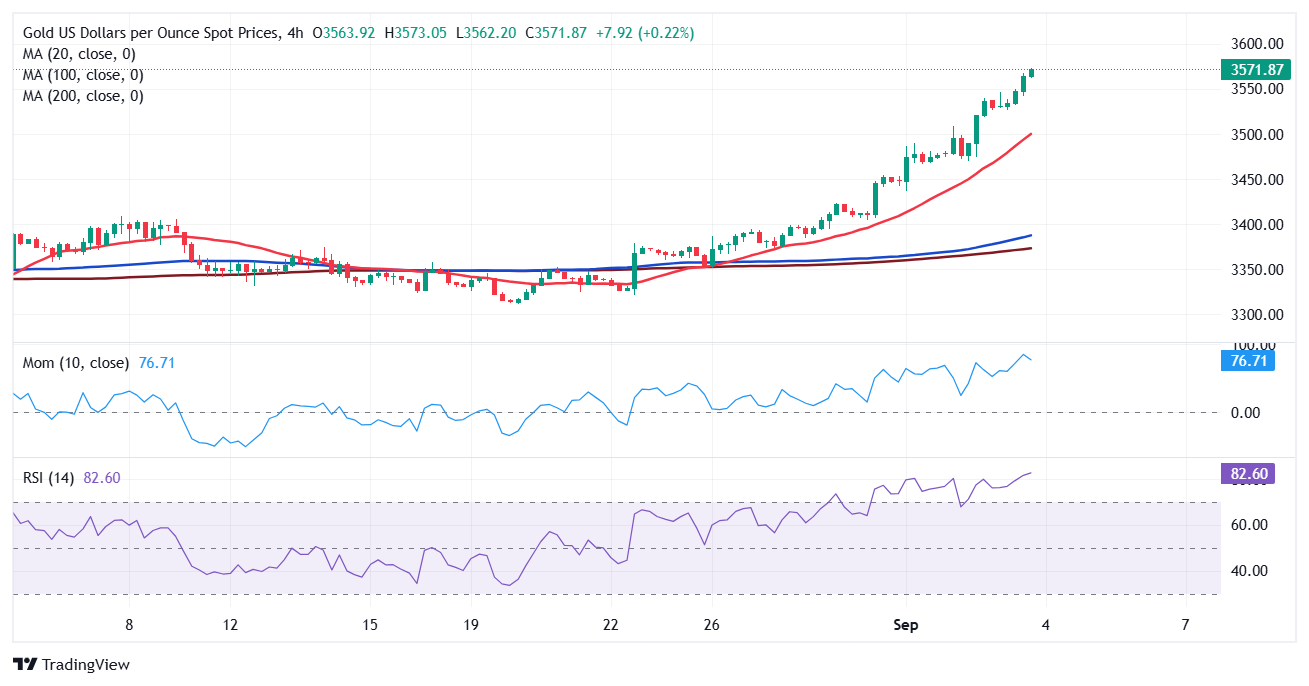
Spot Gold keeps challenging gravity, reaching fresh record highs on Wednesday, and advancing for a seventh consecutive day amid persistent risk aversion. The bright metal surpassed for the first time ever the $3,570 mark, maintaining its positive bias in the mid-American session and aiming to test the next relevant threshold, the $3,600 level.
Safe-haven flows prevailed throughout the first half of the day amid concerns gyrating around long-term government bonds. Global long-term debt suffered after the yield on the United Kingdom 30-year gilt reached multi-year highs on Tuesday.
The US Dollar (USD) found some near-term footing amid the dismal mood, but turned south after the release of United States (US) employment figures. As a result, the bright metal extended its rally.
The US reported that the number of job openings on the last business day of July stood at 7.18 million, according to the US Bureau of Labor Statistics (BLS) and as reported in the Job Openings and Labor Turnover Survey (JOLTS). The reading followed the 7.35 million (revised from 7.43 million) openings recorded in June and came in below the market expectation of 7.4 million.
On Thursday, the focus shifts to the ADP Employment Change report, a survey on private job creation usually released ahead of the official Nonfarm Payrolls (NFP) report. The US will also release the August ISM Services Purchasing Managers’ Index (PMI).
XAU/USD short-term technical outlook
The daily chart for the XAU/USD pair shows that the bullish momentum is strong, as the pair keeps reaching records on an hourly basis. Technical indicators head firmly north despite being in extreme overbought readings. At the same time, the pair develops far above all its moving averages, with the 20 Simple Moving Average (SMA) picking up upward strength yet at around $3,391.
Gold is extremely overbought in the near term, yet there are no technical signs of bullish exhaustion. In the 4-hour chart, the Relative Strength Index (RSI) consolidates at around 84, while the Momentum indicator is partially losing its upward strength at extreme readings. At the same time, the 20 SMA aims higher almost vertically, over $150 above mildly bullish 100 and 200 SMAs, in line with higher highs ahead.
Support levels: 3,551.40 3.538.90 3,526.60
Resistance levels: 3,580.00 3,600 3,615.00
Economic Indicator
Nonfarm Payrolls
The Nonfarm Payrolls release presents the number of new jobs created in the US during the previous month in all non-agricultural businesses; it is released by the US Bureau of Labor Statistics (BLS). The monthly changes in payrolls can be extremely volatile. The number is also subject to strong reviews, which can also trigger volatility in the Forex board. Generally speaking, a high reading is seen as bullish for the US Dollar (USD), while a low reading is seen as bearish, although previous months’ reviews and the Unemployment Rate are as relevant as the headline figure. The market’s reaction, therefore, depends on how the market assesses all the data contained in the BLS report as a whole.
Read more.
