

- AUD/USD reversed three daily upticks in a row, receding to the 0.6540 zone.
- The US Dollar maintained its recovery, helped by firmer results from fundamentals.
- Australia’s trade surplus narrowed to A$2.238 billion in May.
The Australian Dollar (AUD) slipped modestly against its US counterpart on Thursday, with AUD/USD extending its correction to the 0.6540 zone following Tuesday’s highs near 0.6600.
The move lower in the pair came exclusively on the back of further gains in the Greenback, while the Australian docket failed to spark some meaningful reaction. Indeed, the trade surplus shrank to A$2.238 billion in May, while the final S&P Global Services PMI improved to 51.8 in June.
China update
China, Australia’s largest trading partner, painted a mixed but broadly positive picture from its latest releases: May industrial output, retail sales and services activity all accelerated, reinforcing forecasts for roughly 5% annualised GDP growth.
In addition, NBS figures for June showed the Manufacturing PMI at 49.7 and the Non-Manufacturing PMI at 50.5, while Caixin’s Manufacturing PMI rose to 50.4 and the Services PMI receded to 50.6.
Still, strains in the property sector and the gradual withdrawal of stimulus may weigh on growth later in the year.
Central bank divergence
Divergent policy paths remain key drivers on both sides of the Pacific.
IIn June, the Reserve Bank of Australia (RBA) cut its cash rate by 25 basis points to 3.85%, signalling a gradual descent towards 3.20% by 2027 and resisting calls for a deeper “insurance” cut.
TThe Federal Reserve (Fed), on the other hand, held rates steady but reiterated guidance for two 50-bp cuts by year-end, with Chairman Jerome Powell warning that US tariffs could rekindle goods inflation.
Market bets remain on the bearish side
SSpeculators have increased their bearish positions on the AUD. CFTC data through June 24 show net shorts rising to nearly 96K contracts, the highest since April, while open interest is climbing to just over 151K contracts, a two-week high.
Technical perspective
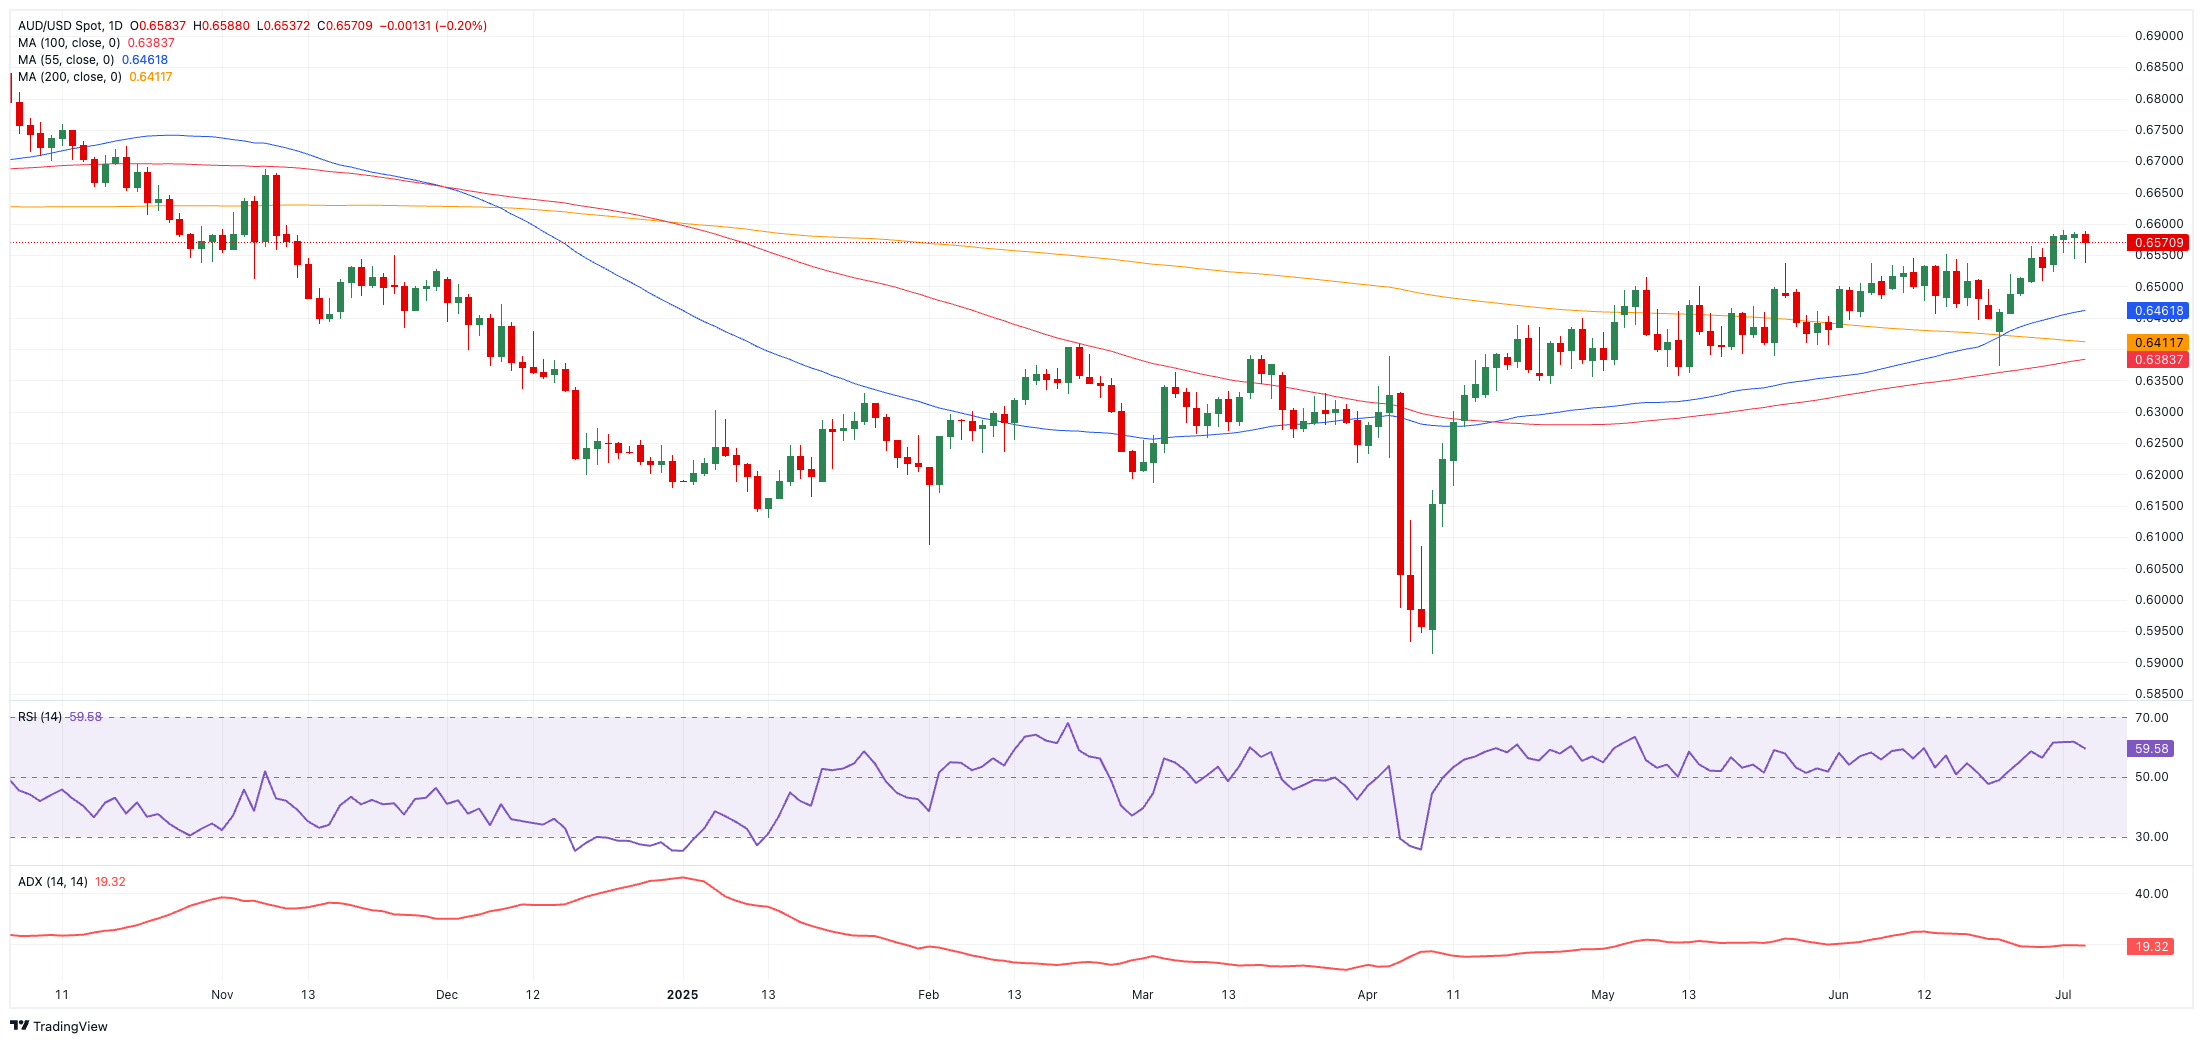
IImmediate resistance is at the 2025 ceiling of 0.6590 (June 30), followed by the next barrier at the November 2024 peak of 0.6687 (November 7), and then the psychological mark of 0.7000.
OOn the downside, the 200-day simple moving average (SMA) of 0.6416 offers initial contention ahead of the June trough of 0.6372 (June 23) and the May low of 0.6356 (May 12). A break below those levels could expose the 0.6000 milestone and the 2025 bottom of 0.5913 (April 9).
Momentum indicators paint a mixed picture: The Relative Strength Index (RSI), which is hovering near 60, suggests that there is further upside potential, while the Average Directional Index (ADX) reading of near 22 indicates a moderately firm trend.
AUD/USD daily chart
Short-term outlook
AUD/USD appears to have surpassed its multi-week consolidation range. The policy mix in Beijing and any unexpected changes in US trade settings represent the most significant variables, although neither appears to be on the horizon at this time.
MMarkets are preparing for a potential modest cut by the RBA later this year, as they anticipate that the bank will adopt a cautious approach rather than initiating an aggressive easing cycle.
IIn summary, the positive outlook for the Australian Dollar is likely to persist in the near term, with gradual increases anticipated unless an unexpected external influence occurs and as long as it remains above its 200-day SMA.
Australian Dollar PRICE Today
The table below shows the percentage change of Australian Dollar (AUD) against listed major currencies today. Australian Dollar was the strongest against the Japanese Yen.
| USD | EUR | GBP | JPY | CAD | AUD | NZD | CHF | |
|---|---|---|---|---|---|---|---|---|
| USD | 0.46% | -0.03% | 1.03% | -0.17% | 0.25% | 0.49% | 0.63% | |
| EUR | -0.46% | -0.49% | 0.60% | -0.63% | -0.21% | 0.00% | 0.20% | |
| GBP | 0.03% | 0.49% | 1.07% | -0.13% | 0.26% | 0.47% | 0.49% | |
| JPY | -1.03% | -0.60% | -1.07% | -1.19% | -0.76% | -0.60% | -0.51% | |
| CAD | 0.17% | 0.63% | 0.13% | 1.19% | 0.41% | 0.62% | 0.84% | |
| AUD | -0.25% | 0.21% | -0.26% | 0.76% | -0.41% | 0.04% | 0.23% | |
| NZD | -0.49% | -0.00% | -0.47% | 0.60% | -0.62% | -0.04% | 0.00% | |
| CHF | -0.63% | -0.20% | -0.49% | 0.51% | -0.84% | -0.23% | -0.01% |
The heat map shows percentage changes of major currencies against each other. The base currency is picked from the left column, while the quote currency is picked from the top row. For example, if you pick the Australian Dollar from the left column and move along the horizontal line to the US Dollar, the percentage change displayed in the box will represent AUD (base)/USD (quote).
