

Bullish view
- Buy the BTC/USD pair and set a take-profit at 120,000.
- Add a stop-loss at 112,000.
- Timeline: 1-2 days.
Bearish view
- Sell the BTC/USD pair and set a take-profit at 112,000.
- Add a stop-loss at 121,000.
Bitcoin price jumped to the highest level since August as investors predicted that more gains would happen in the so-called Uptober. It also happened as the government shutdown pushed more people to the coin.. The BTC/USD pair rose 117,550, up by almost 10% from the lowest level in September.
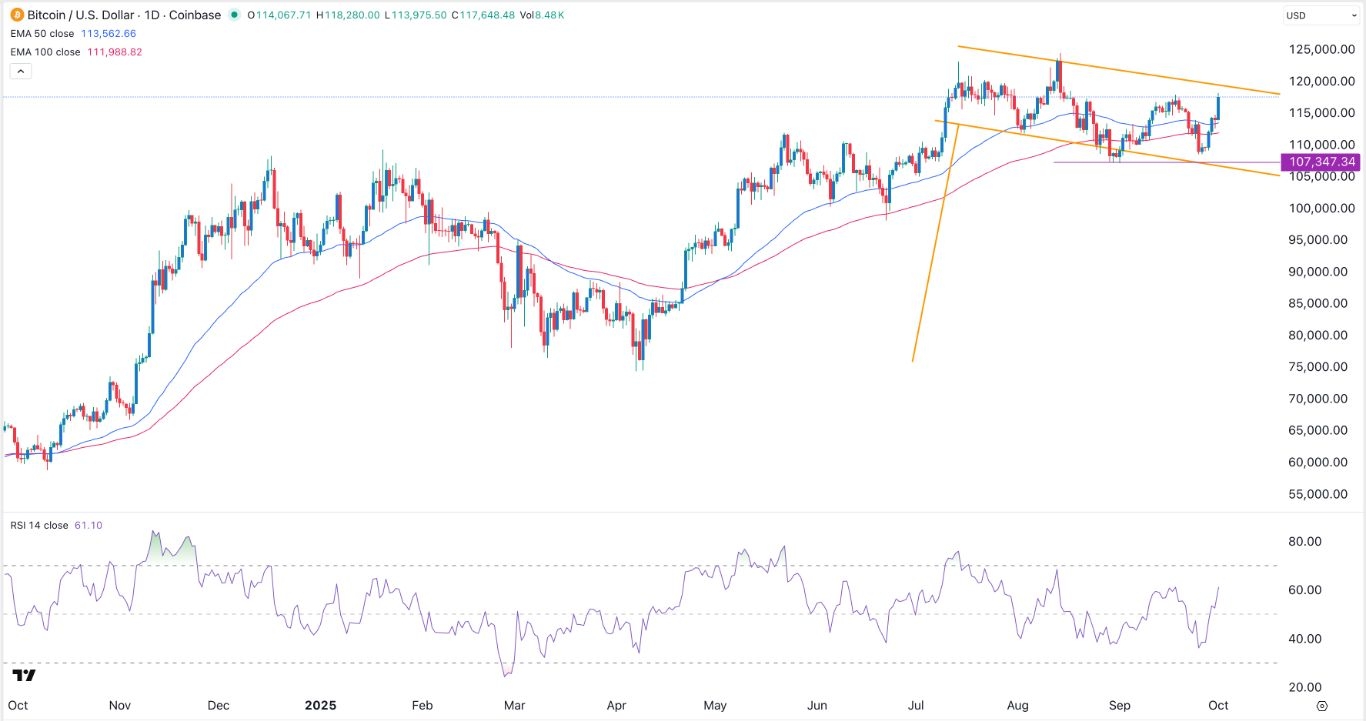
Bitcoin Price Rallies as Government Shutdown Happens
The BTC/USD pair jumped for several reasons. First, Bitcoin joined gold, which has been in a strong bull run this year and is now hovering at its all-time high. Bitcoin is often seen as a digital alternative to gold.
Second, the BTC/USD pair rose as hopes that the Federal Reserve will cut interest rates in the coming meetings rose. One of the main reasons for this is that the US government has gone through a shutdown, which could go on for weeks. A prolonged shutdown will affect the country’s economic growth.
Meanwhile, the labor market has continued to deteriorate in the past few months. A report released on Wednesday by ADP showed that the private sector shed over 30k jobs in September, lower than the expected increase of 50,000. ADP also lowered its previously released August payrolls data to show that the economy shed 3k jobs.
American companies have been hesitant in their hiring this year because of Donald Trump’s trade policies, which have included substantial layoffs. Therefore, the Fed will likely continue cutting interest rates as it did in the last meeting in September.
Third, Bitcoin price has done well because of the rising demand from American investors, who have piled into spot Bitcoin ETFs this week. ETF inflows have jumped by over $1 billion this week, a trend that may continue in the coming weeks.
Additionally, October has historically been one of Bitcoin’s best months as it has a track record of rising, in what is known as Uptober.
BTC/USD Technical Analysis
The daily timeframe chart shows that the BTC/USD pair has bounced back in the past few days. It moved from a low of 108,560 last week to the current 117,500.
Bitcoin price has moved above the 50-day moving average, while most oscillators have pointed upwards. It has formed a bullish flag pattern, which is made up of a vertical line and a descending channel. It has now retested the upper side of this channel.
Therefore, the pair will likely have a strong bullish breakout in the coming days, potentially to the psychological level at 120,000. A move above that price will see it hit the resistance at $124,000.
Ready to trade Bitcoin forecasts & predictions? We’ve shortlisted the best MT4 crypto brokers in the industry for you.
Crispus Nyaga is a financial analyst, coach, and trader with more than 8 years in the industry. He has worked for leading companies like ATFX, easyMarkets, and OctaFx. Further, he has published widely in platforms like SeekingAlpha, Investing Cube, Capital.com, and Invezz. In his free time, he likes watching golf and spending time with his wife and child.
