

Solana (SOL) is trading near $173, recovering strongly after defending the key $160–$165 support area earlier this week.
The bounce has flipped short-term momentum back in favor of bulls, with renewed interest from traders and growing network activity.
SOL Retesting July Breakdown Zone
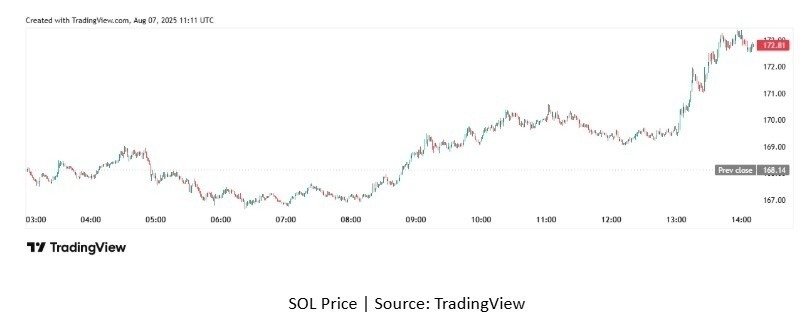
SOL Price | Source: TradingView
SOL has climbed over 3% in 24 hours, reversing losses from last week and positioning for a move toward $180.
The rebound follows a textbook retest of descending triangle support near $160. Buyers stepped in aggressively as market sentiment improved across majors.
Bitcoin’s stability above $116,000 and Ethereum near $3,815 helped altcoins regain strength. Solana, in particular, is showing clearer structure and relative strength after forming a base near recent lows.
Key Support Zone for Bulls
Immediate support sits between $168 and $171, a former resistance band that now provides a base for any short-term consolidation.
If SOL breaks below $168, it could revisit $162, followed by a stronger support cluster at $154–$156.
To the upside, $175 is acting as the next resistance. That level aligns with failed support from July and intraday highs from late last week. If cleared, the path opens toward $180, followed by the $192–$198 zone, which includes the 0.786 Fibonacci level and a prior failed breakout point.
RSI Nearing Overbought, But MACD Flashes Green
The RSI on the 4-hour chart is approaching 70, signaling a short-term overbought condition. However, the daily RSI remains around 65, suggesting there’s still room for continuation before technical exhaustion.
The MACD has flipped bullish on both 4-hour and daily timeframes. A fresh crossover and widening histogram support the case for upward follow-through.
Solana is also trading along the upper Bollinger Band, often a sign of strong momentum, but one that tends to precede sideways chop or mild pullbacks.
Network Activity Improves as Traders Accumulate
On-chain data shows signs of renewed activity. Active addresses and daily transactions on the Solana network have risen steadily this week, reinforcing the move with a fundamental tailwind.
Wallet data points to accumulation by large holders, particularly during the dip to $160. While exchange inflows have ticked up slightly, hinting at potential profit-taking, the overall flow remains neutral to bullish.
Developer commits and DeFi activity on Solana continue to trend upward, adding support to the narrative of recovery and ecosystem resilience.
Breakout Above $175 Could Trigger $180–$192 Run
If Solana manages a clean daily close above $175, momentum traders will likely target the $180 round number first, followed by the previous swing zone between $192 and $198.
Failure to hold current levels could mean a retrace to the $168–$171 support band.
A breakdown below $160, however, would invalidate the bullish structure and expose downside risk toward $148 or lower, especially if Bitcoin weakens.
Solana Rebuilds Structure, But Volume Must Confirm
Structurally, Solana looks stronger than many peers. The recovery from $160 was orderly, with higher lows on shorter timeframes and no major resistance until $175.
But volume remains the missing piece. Spot trading volumes have risen slightly, but not yet to breakout-confirming levels. A move through $175 without volume expansion may struggle to sustain itself.
Watch for whether buyers show up in force on any $175 breakout attempt. Without that confirmation, the move risks stalling just below resistance.
Final Take
Solana is showing signs of life after a critical support hold at $160. The technical bounce has legs, but the $175 level is make-or-break.
A clean push through it, ideally with rising volume, sets up a run to $180 and possibly $192. Failure to reclaim that level could trap late buyers and bring the token back into consolidation.
Traders should stay focused on how the price behaves around $175. This zone will likely define the next leg, up or down.
